
|
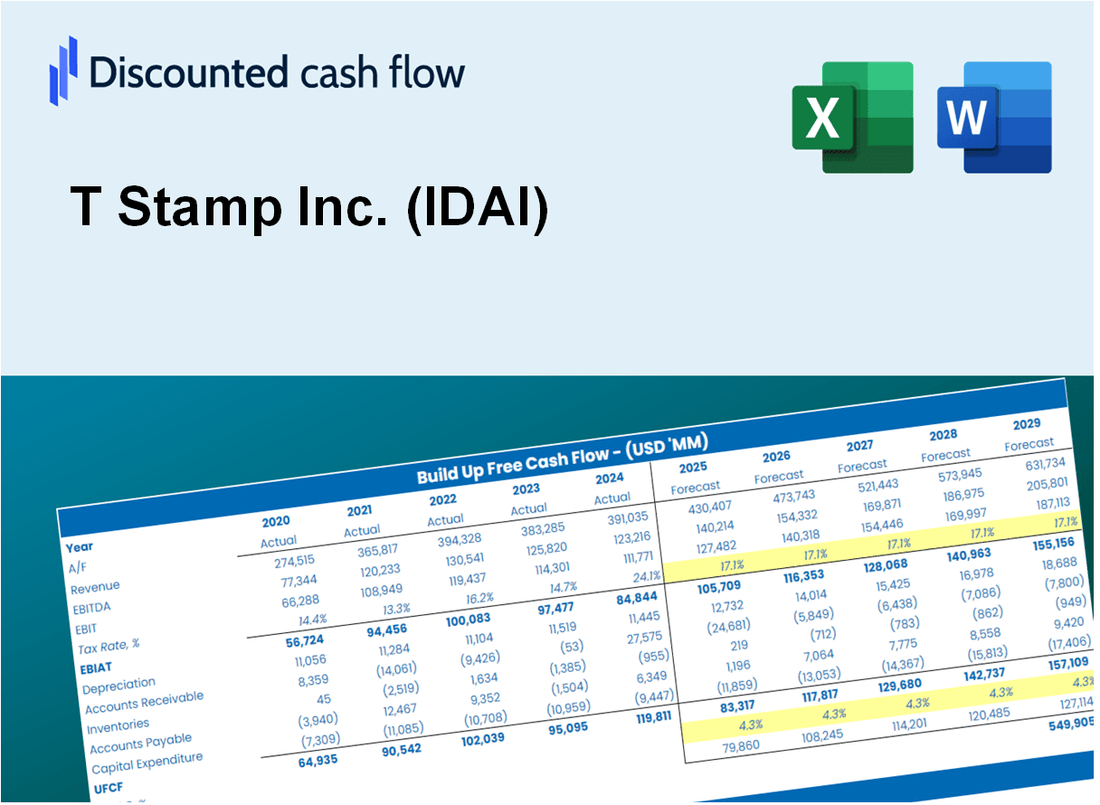
T Stamp Inc. (IDAI) DCF -Bewertung |
Fully Editable: Tailor To Your Needs In Excel Or Sheets
Professional Design: Trusted, Industry-Standard Templates
Investor-Approved Valuation Models
MAC/PC Compatible, Fully Unlocked
No Expertise Is Needed; Easy To Follow
T Stamp Inc. (IDAI) Bundle
Möchten Sie den inneren Wert von T Stamp Inc. beurteilen? Unser (IDAI) DCF-Taschenrechner integriert reale Daten mit umfangreichen Anpassungsfunktionen, sodass Sie Ihre Prognosen verfeinern und Ihre Anlageentscheidungen verbessern können.
Discounted Cash Flow (DCF) - (USD MM)
| Year | AY1 2020 |
AY2 2021 |
AY3 2022 |
AY4 2023 |
AY5 2024 |
FY1 2025 |
FY2 2026 |
FY3 2027 |
FY4 2028 |
FY5 2029 |
|---|---|---|---|---|---|---|---|---|---|---|
| Revenue | 2.6 | 3.7 | 5.4 | 4.6 | 3.1 | 3.4 | 3.7 | 4.0 | 4.4 | 4.8 |
| Revenue Growth, % | 0 | 38.88 | 46.42 | -15.32 | -32.41 | 9.39 | 9.39 | 9.39 | 9.39 | 9.39 |
| EBITDA | -10.1 | -8.4 | -11.0 | -7.6 | -9.4 | -3.4 | -3.7 | -4.0 | -4.4 | -4.8 |
| EBITDA, % | -381.06 | -229.62 | -204.92 | -167.23 | -303.59 | -100 | -100 | -100 | -100 | -100 |
| Depreciation | .4 | .6 | 1.0 | .2 | .7 | .5 | .6 | .6 | .7 | .8 |
| Depreciation, % | 15.34 | 15.6 | 19.06 | 5.1 | 23.68 | 15.76 | 15.76 | 15.76 | 15.76 | 15.76 |
| EBIT | -10.5 | -9.0 | -12.1 | -7.9 | -10.1 | -3.4 | -3.7 | -4.0 | -4.4 | -4.8 |
| EBIT, % | -396.4 | -245.22 | -223.98 | -172.33 | -327.27 | -100 | -100 | -100 | -100 | -100 |
| Total Cash | 1.5 | 3.5 | 1.3 | 3.1 | 2.8 | 2.2 | 2.5 | 2.7 | 2.9 | 3.2 |
| Total Cash, percent | .0 | .0 | .0 | .0 | .0 | .0 | .0 | .0 | .0 | .0 |
| Account Receivables | .3 | 1.4 | 1.3 | .7 | 1.4 | .9 | 1.0 | 1.1 | 1.2 | 1.3 |
| Account Receivables, % | 10.22 | 39.04 | 24.85 | 15.05 | 46.73 | 27.18 | 27.18 | 27.18 | 27.18 | 27.18 |
| Inventories | .0 | -.5 | -.3 | .0 | .0 | -.1 | -.1 | -.2 | -.2 | -.2 |
| Inventories, % | 0 | -13.32 | -6.12 | 0 | 0 | -3.89 | -3.89 | -3.89 | -3.89 | -3.89 |
| Accounts Payable | .4 | .3 | .9 | 1.2 | .3 | .5 | .6 | .6 | .7 | .7 |
| Accounts Payable, % | 14.37 | 8.27 | 17.55 | 27.02 | 9.67 | 15.38 | 15.38 | 15.38 | 15.38 | 15.38 |
| Capital Expenditure | -.5 | -.8 | -1.0 | -.6 | -.8 | -.7 | -.7 | -.8 | -.9 | -1.0 |
| Capital Expenditure, % | -19.34 | -20.89 | -18.23 | -13.92 | -26.17 | -19.71 | -19.71 | -19.71 | -19.71 | -19.71 |
| Tax Rate, % | -0.07365994 | -0.07365994 | -0.07365994 | -0.07365994 | -0.07365994 | -0.07365994 | -0.07365994 | -0.07365994 | -0.07365994 | -0.07365994 |
| EBITAT | -10.8 | -8.9 | -12.1 | -7.8 | -10.1 | -3.4 | -3.7 | -4.0 | -4.4 | -4.8 |
| Depreciation | ||||||||||
| Changes in Account Receivables | ||||||||||
| Changes in Inventories | ||||||||||
| Changes in Accounts Payable | ||||||||||
| Capital Expenditure | ||||||||||
| UFCF | -10.8 | -9.8 | -11.5 | -7.6 | -11.9 | -2.6 | -3.8 | -4.2 | -4.6 | -5.0 |
| WACC, % | 8.79 | 8.7 | 8.79 | 8.78 | 8.79 | 8.77 | 8.77 | 8.77 | 8.77 | 8.77 |
| PV UFCF | ||||||||||
| SUM PV UFCF | -15.5 | |||||||||
| Long Term Growth Rate, % | 2.00 | |||||||||
| Free cash flow (T + 1) | -5 | |||||||||
| Terminal Value | -76 | |||||||||
| Present Terminal Value | -50 | |||||||||
| Enterprise Value | -65 | |||||||||
| Net Debt | 1 | |||||||||
| Equity Value | -67 | |||||||||
| Diluted Shares Outstanding, MM | 1 | |||||||||
| Equity Value Per Share | -60.36 |
What You Will Receive
- Comprehensive Financial Model: T Stamp Inc.'s (IDAI) real data provides an accurate DCF valuation.
- Complete Forecast Flexibility: Modify revenue growth, profit margins, WACC, and other essential factors.
- Real-Time Calculations: Automatic updates allow you to view results instantly as adjustments are made.
- Professional-Grade Template: A polished Excel file crafted for high-quality valuation processes.
- Adaptable and Reusable: Designed for versatility, enabling repeated use for in-depth forecasts.
Key Features
- Comprehensive Data Access: T Stamp Inc.'s historical financial records and projected forecasts.
- Customizable Parameters: Modify WACC, tax rates, revenue growth, and EBITDA margins as needed.
- Real-Time Insights: Observe T Stamp Inc.'s intrinsic value update instantly.
- Intuitive Visualizations: Dashboard graphs illustrate valuation outcomes and essential metrics.
- Designed for Precision: A robust tool tailored for analysts, investors, and finance professionals.
How It Works
- Download the Template: Gain immediate access to the Excel-based T Stamp Inc. (IDAI) DCF Calculator.
- Input Your Assumptions: Modify the yellow-highlighted cells for growth rates, WACC, margins, and additional parameters.
- Instant Calculations: The model automatically recalculates T Stamp Inc.'s intrinsic value.
- Test Scenarios: Experiment with different assumptions to assess potential changes in valuation.
- Analyze and Decide: Leverage the results to inform your investment or financial analysis.
Why Choose T Stamp Inc. (IDAI) Calculator?
- User-Friendly Interface: Perfect for both novices and seasoned professionals.
- Customizable Inputs: Adjust parameters easily to suit your specific analysis needs.
- Real-Time Feedback: Observe immediate changes in T Stamp Inc.'s valuation as you tweak inputs.
- Preloaded Financial Data: Comes equipped with T Stamp Inc.'s actual financial information for swift evaluations.
- Relied Upon by Experts: Favored by investors and analysts for making well-informed choices.
Who Should Use This Product?
- Individual Investors: Gain insights to make informed decisions about buying or selling T Stamp Inc. (IDAI) stock.
- Financial Analysts: Enhance valuation processes with comprehensive financial models tailored for T Stamp Inc. (IDAI).
- Consultants: Provide clients with accurate and timely valuation insights regarding T Stamp Inc. (IDAI).
- Business Owners: Learn how companies like T Stamp Inc. (IDAI) are valued to inform your own business strategies.
- Finance Students: Explore real-world valuation techniques using T Stamp Inc. (IDAI) as a case study.
What the Template Contains
- Historical Data: Includes T Stamp Inc.’s (IDAI) past financials and baseline forecasts.
- DCF and Levered DCF Models: Detailed templates to calculate T Stamp Inc.’s (IDAI) intrinsic value.
- WACC Sheet: Pre-built calculations for Weighted Average Cost of Capital.
- Editable Inputs: Modify key drivers like growth rates, EBITDA %, and CAPEX assumptions.
- Quarterly and Annual Statements: A complete breakdown of T Stamp Inc.’s (IDAI) financials.
- Interactive Dashboard: Visualize valuation results and projections dynamically.
Disclaimer
All information, articles, and product details provided on this website are for general informational and educational purposes only. We do not claim any ownership over, nor do we intend to infringe upon, any trademarks, copyrights, logos, brand names, or other intellectual property mentioned or depicted on this site. Such intellectual property remains the property of its respective owners, and any references here are made solely for identification or informational purposes, without implying any affiliation, endorsement, or partnership.
We make no representations or warranties, express or implied, regarding the accuracy, completeness, or suitability of any content or products presented. Nothing on this website should be construed as legal, tax, investment, financial, medical, or other professional advice. In addition, no part of this site—including articles or product references—constitutes a solicitation, recommendation, endorsement, advertisement, or offer to buy or sell any securities, franchises, or other financial instruments, particularly in jurisdictions where such activity would be unlawful.
All content is of a general nature and may not address the specific circumstances of any individual or entity. It is not a substitute for professional advice or services. Any actions you take based on the information provided here are strictly at your own risk. You accept full responsibility for any decisions or outcomes arising from your use of this website and agree to release us from any liability in connection with your use of, or reliance upon, the content or products found herein.