
|
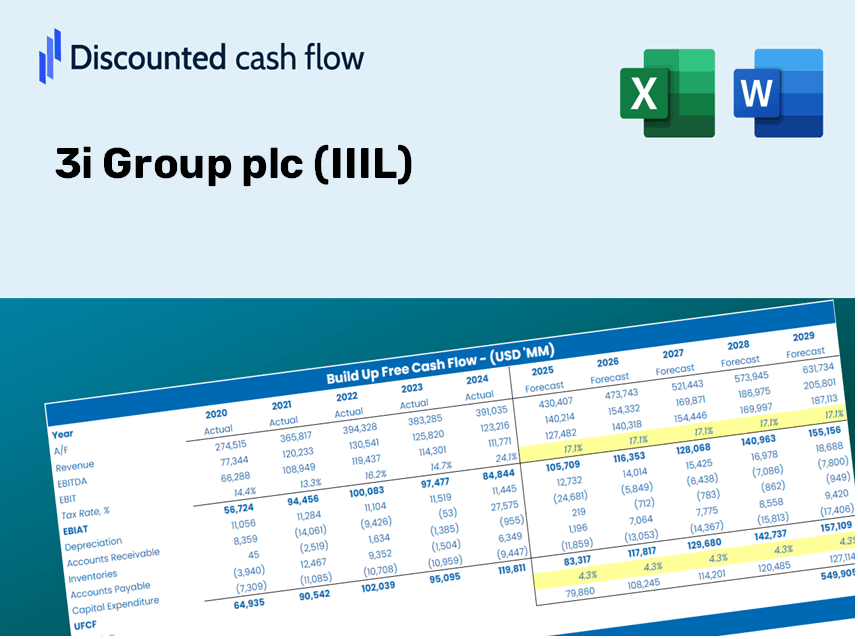
3i Group Plc (III.L) DCF -Bewertung |
Fully Editable: Tailor To Your Needs In Excel Or Sheets
Professional Design: Trusted, Industry-Standard Templates
Investor-Approved Valuation Models
MAC/PC Compatible, Fully Unlocked
No Expertise Is Needed; Easy To Follow
3i Group plc (III.L) Bundle
Unser (iiil) DCF-Taschenrechner entwickelt für die Genauigkeit und ermöglicht es Ihnen, die Bewertung von 3i Group PLC mithilfe realer Finanzdaten zu bewerten und vollständige Flexibilität zu bieten, um alle wesentlichen Parameter für verbesserte Prognosen zu ändern.
What You'll Receive
- Adjustable Forecast Parameters: Seamlessly modify key metrics (growth %, margins, WACC) to explore various scenarios.
- Comprehensive Market Data: Pre-loaded financial information for 3i Group plc (IIIL) to accelerate your analysis.
- Instant DCF Calculations: The model computes Net Present Value (NPV) and intrinsic value automatically.
- Professional and Tailored: A refined Excel model designed to meet your valuation requirements.
- Engineered for Analysts and Investors: Perfect for evaluating forecasts, confirming strategies, and enhancing efficiency.
Key Features
- Customizable Financial Inputs: Adjust essential parameters such as investment returns, operating profitability, and funding allocations.
- Instant DCF Valuation: Quickly computes intrinsic value, net present value (NPV), and other financial metrics.
- High-Precision Results: Leverages 3i Group plc’s (IIIL) real financial data for accurate valuation assessments.
- Streamlined Scenario Testing: Effortlessly evaluate various assumptions and analyze different outcomes.
- Efficiency Booster: Avoid the hassle of creating complex valuation models from the ground up.
How It Works
- Step 1: Download the prebuilt Excel template containing 3i Group plc’s (IIIL) data.
- Step 2: Navigate through the pre-filled sheets to familiarize yourself with the essential metrics.
- Step 3: Adjust forecasts and assumptions in the editable yellow cells (WACC, growth, margins).
- Step 4: Instantly view the recalibrated results, including the intrinsic value of 3i Group plc (IIIL).
- Step 5: Use the outputs to make informed investment decisions or create detailed reports.
Why Choose This Calculator for 3i Group plc (IIIL)?
- All-in-One Solution: Features DCF, WACC, and financial ratio analyses seamlessly integrated.
- Tailored Inputs: Modify the yellow-highlighted fields to explore different scenarios.
- In-Depth Analysis: Automatically computes 3i Group plc’s intrinsic value and Net Present Value.
- Data Ready: Comes with both historical and projected data for precise starting points.
- Expert Level: Perfect for financial analysts, investors, and business advisors.
Who Is This Product Designed For?
- Institutional Investors: Develop comprehensive and trustworthy valuation models for portfolio evaluation.
- Corporate Finance Departments: Assess valuation scenarios to inform strategic decisions.
- Consultants and Financial Advisors: Equip clients with precise valuation insights for 3i Group plc (IIIL) shares.
- Students and Instructors: Utilize real-time data for practical application and teaching of financial modeling.
- Investment Enthusiasts: Gain insights into how private equity firms like 3i Group plc (IIIL) are evaluated in the market.
Contents of the Template
- Pre-Filled DCF Model: Financial data for 3i Group plc (IIIL) ready for immediate application.
- WACC Calculator: Comprehensive calculations for Weighted Average Cost of Capital.
- Financial Ratios: Analyze 3i Group plc (IIIL)’s profitability, leverage, and operational efficiency.
- Editable Inputs: Adjust variables such as growth rates, profit margins, and CAPEX to align with your scenarios.
- Financial Statements: Access annual and quarterly reports for in-depth analysis.
- Interactive Dashboard: Easily visualize essential valuation metrics and outcomes.
Disclaimer
All information, articles, and product details provided on this website are for general informational and educational purposes only. We do not claim any ownership over, nor do we intend to infringe upon, any trademarks, copyrights, logos, brand names, or other intellectual property mentioned or depicted on this site. Such intellectual property remains the property of its respective owners, and any references here are made solely for identification or informational purposes, without implying any affiliation, endorsement, or partnership.
We make no representations or warranties, express or implied, regarding the accuracy, completeness, or suitability of any content or products presented. Nothing on this website should be construed as legal, tax, investment, financial, medical, or other professional advice. In addition, no part of this site—including articles or product references—constitutes a solicitation, recommendation, endorsement, advertisement, or offer to buy or sell any securities, franchises, or other financial instruments, particularly in jurisdictions where such activity would be unlawful.
All content is of a general nature and may not address the specific circumstances of any individual or entity. It is not a substitute for professional advice or services. Any actions you take based on the information provided here are strictly at your own risk. You accept full responsibility for any decisions or outcomes arising from your use of this website and agree to release us from any liability in connection with your use of, or reliance upon, the content or products found herein.