
|
Indaptus Therapeutics, Inc. (INDP) DCF -Bewertung |
Fully Editable: Tailor To Your Needs In Excel Or Sheets
Professional Design: Trusted, Industry-Standard Templates
Investor-Approved Valuation Models
MAC/PC Compatible, Fully Unlocked
No Expertise Is Needed; Easy To Follow
Indaptus Therapeutics, Inc. (INDP) Bundle
Vereinfachen Sie die Bewertung von Indaptus Therapeutics, Inc. (INDP) mit diesem anpassbaren DCF -Taschenrechner! Mit echten Indaptus -Finanzmitteln und einstellbaren Prognoseeingaben können Sie Szenarien testen und den Fair -Wert von Indaptus in Minuten aufdecken.
What You Will Receive
- Customizable Excel Template: A fully adaptable Excel-based DCF Calculator featuring pre-filled financial data for Indaptus Therapeutics, Inc. (INDP).
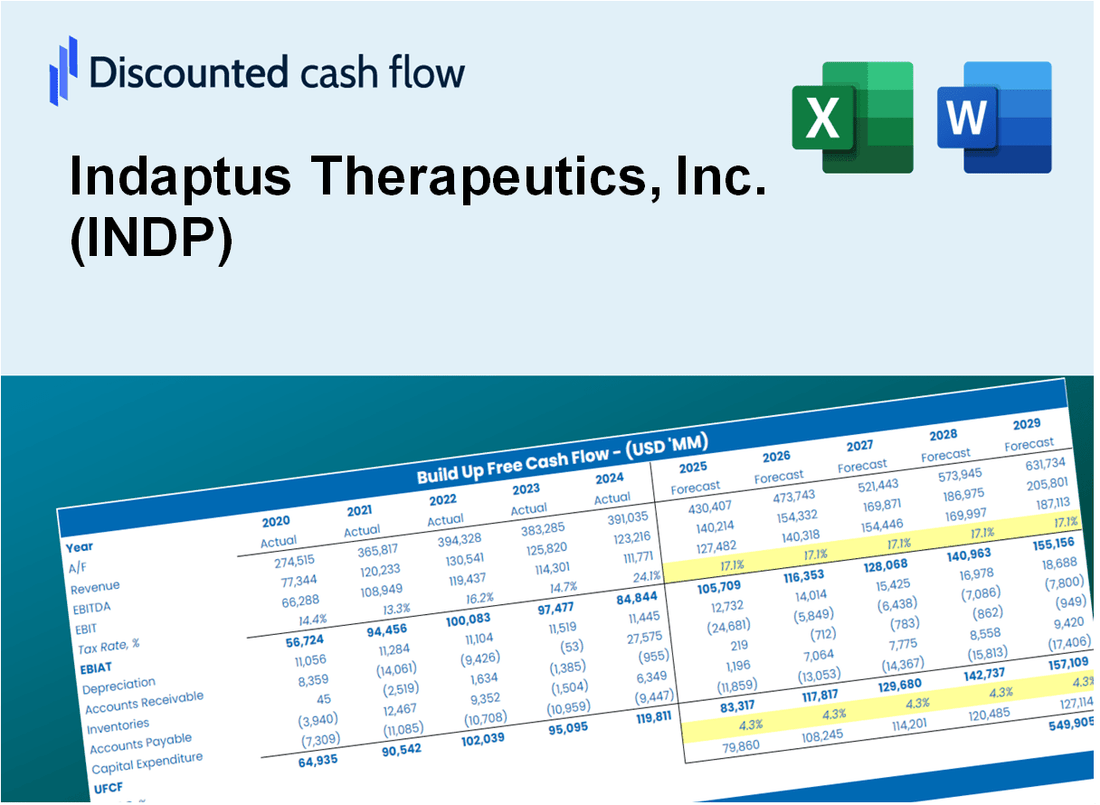
- Comprehensive Data: Historical performance data and forward-looking projections (as indicated in the highlighted cells).
- Flexible Forecasting: Modify forecast parameters such as revenue growth, EBITDA %, and WACC.
- Instant Calculations: Quickly observe how your inputs affect the valuation of Indaptus Therapeutics, Inc. (INDP).
- Professional Resource: Designed for investors, CFOs, consultants, and financial analysts.
- Intuitive Layout: Organized for clarity and user-friendliness, complete with step-by-step guidance.
Key Features
- 🔍 Real-Life INDP Financials: Pre-filled historical and projected data for Indaptus Therapeutics, Inc.
- ✏️ Fully Customizable Inputs: Adjust all critical parameters (yellow cells) like WACC, growth %, and tax rates.
- 📊 Professional DCF Valuation: Built-in formulas calculate Indaptus’s intrinsic value using the Discounted Cash Flow method.
- ⚡ Instant Results: Visualize Indaptus’s valuation instantly after making changes.
- Scenario Analysis: Test and compare outcomes for various financial assumptions side-by-side.
How It Works
- Step 1: Download the Excel file.
- Step 2: Review pre-entered Indaptus Therapeutics data (historical and projected).
- Step 3: Adjust key assumptions (yellow cells) based on your analysis.
- Step 4: View automatic recalculations for Indaptus Therapeutics’ intrinsic value.
- Step 5: Use the outputs for investment decisions or reporting.
Why Choose Indaptus Therapeutics, Inc. (INDP) Calculator?
- User-Friendly Interface: Tailored for both novice users and seasoned professionals.
- Customizable Inputs: Adjust parameters easily to suit your specific analysis needs.
- Real-Time Feedback: Observe immediate updates to Indaptus's valuation as you change inputs.
- Preloaded Data: Comes with Indaptus's latest financial metrics for swift evaluations.
- Relied Upon by Experts: Favored by investors and analysts for making well-informed choices.
Who Should Use This Product?
- Biotech Students: Explore drug development processes and apply theoretical knowledge to real-world scenarios.
- Researchers: Utilize advanced models in their studies related to therapeutic innovations.
- Investors: Evaluate your investment strategies and analyze valuation metrics for Indaptus Therapeutics, Inc. (INDP).
- Market Analysts: Enhance your analysis with a customizable model tailored for biotech evaluations.
- Healthcare Entrepreneurs: Understand how emerging biotech companies like Indaptus Therapeutics, Inc. (INDP) are assessed in the market.
What the Template Contains
- Pre-Filled Data: Includes Indaptus Therapeutics, Inc.'s historical financials and projections.
- Discounted Cash Flow Model: Editable DCF valuation model with automatic calculations.
- Weighted Average Cost of Capital (WACC): A dedicated sheet for calculating WACC based on custom inputs.
- Key Financial Ratios: Analyze Indaptus Therapeutics, Inc.'s profitability, efficiency, and leverage.
- Customizable Inputs: Edit revenue growth, margins, and tax rates with ease.
- Clear Dashboard: Charts and tables summarizing key valuation results.
Disclaimer
All information, articles, and product details provided on this website are for general informational and educational purposes only. We do not claim any ownership over, nor do we intend to infringe upon, any trademarks, copyrights, logos, brand names, or other intellectual property mentioned or depicted on this site. Such intellectual property remains the property of its respective owners, and any references here are made solely for identification or informational purposes, without implying any affiliation, endorsement, or partnership.
We make no representations or warranties, express or implied, regarding the accuracy, completeness, or suitability of any content or products presented. Nothing on this website should be construed as legal, tax, investment, financial, medical, or other professional advice. In addition, no part of this site—including articles or product references—constitutes a solicitation, recommendation, endorsement, advertisement, or offer to buy or sell any securities, franchises, or other financial instruments, particularly in jurisdictions where such activity would be unlawful.
All content is of a general nature and may not address the specific circumstances of any individual or entity. It is not a substitute for professional advice or services. Any actions you take based on the information provided here are strictly at your own risk. You accept full responsibility for any decisions or outcomes arising from your use of this website and agree to release us from any liability in connection with your use of, or reliance upon, the content or products found herein.