
|
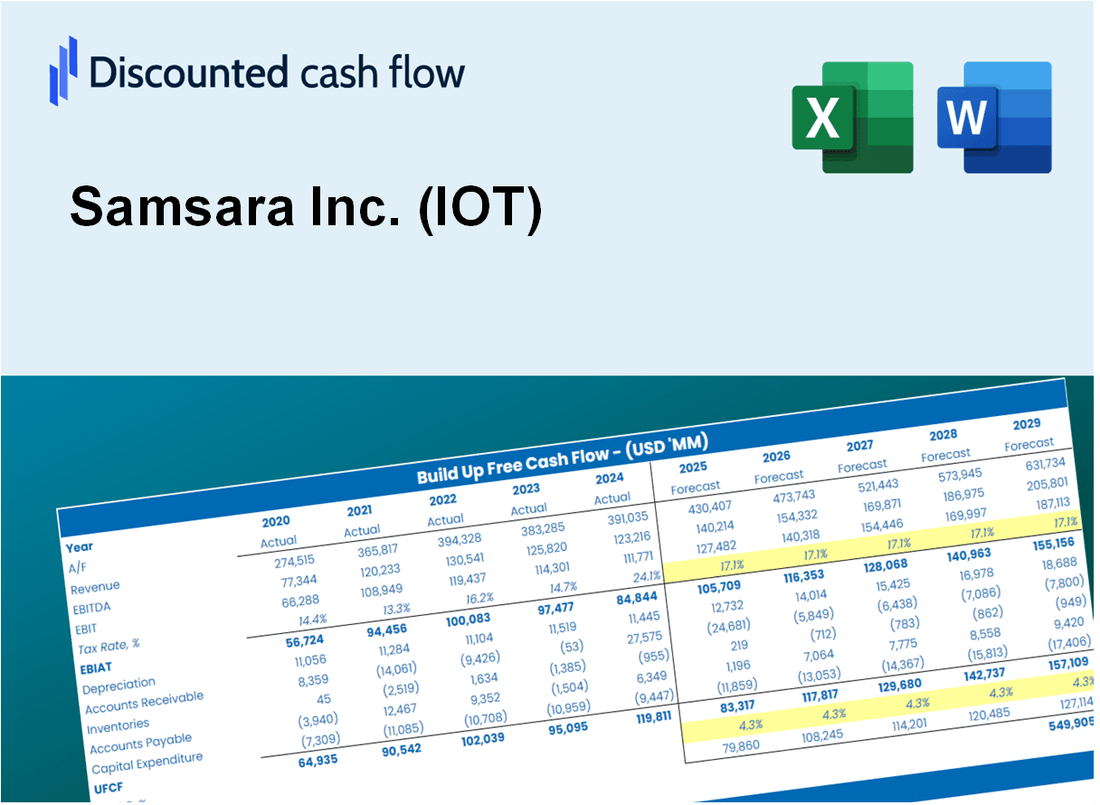
Samsara Inc. (IoT) DCF -Bewertung |
Fully Editable: Tailor To Your Needs In Excel Or Sheets
Professional Design: Trusted, Industry-Standard Templates
Investor-Approved Valuation Models
MAC/PC Compatible, Fully Unlocked
No Expertise Is Needed; Easy To Follow
Samsara Inc. (IOT) Bundle
Verbessern Sie Ihre Investitionsauswahl mit dem DCF -Taschenrechner von Samsara Inc. (IoT)! Verwenden Sie echte Samsara -Finanzdaten, passen Sie Wachstumsprojektionen und -kosten an und beobachten Sie sofort, wie sich Modifikationen auf den intrinsischen Wert von Samsara Inc. (IoT) auswirken.
What You Will Get
- Comprehensive IOT Financials: Access to historical and projected data for precise valuation.
- Customizable Inputs: Adjust WACC, tax rates, revenue growth, and capital expenditures as needed.
- Dynamic Calculations: Intrinsic value and NPV are computed in real-time.
- Scenario Analysis: Explore various scenarios to assess Samsara's future performance.
- User-Friendly Design: Designed for professionals while remaining approachable for newcomers.
Key Features
- 🔍 Real-Life IOT Financials: Pre-filled historical and projected data for Samsara Inc.
- ✏️ Fully Customizable Inputs: Adjust all critical parameters (yellow cells) like WACC, growth %, and tax rates.
- 📊 Professional DCF Valuation: Built-in formulas calculate Samsara’s intrinsic value using the Discounted Cash Flow method.
- ⚡ Instant Results: Visualize Samsara’s valuation instantly after making changes.
- Scenario Analysis: Test and compare outcomes for various financial assumptions side-by-side.
How It Works
- Download: Obtain the pre-built Excel file containing Samsara Inc.'s (IOT) financial data.
- Customize: Modify projections such as revenue growth, EBITDA %, and WACC as needed.
- Update Automatically: Watch as intrinsic value and NPV calculations refresh in real-time.
- Test Scenarios: Develop various forecasts and instantly compare the results.
- Make Decisions: Leverage the valuation outcomes to inform your investment strategies.
Why Choose Samsara Inc. (IOT)?
- Save Time: Get instant access to IoT solutions without the hassle of extensive setup.
- Enhance Efficiency: Streamlined operations and real-time data analytics help minimize downtime.
- Fully Scalable: Easily expand your system to accommodate growing business needs.
- User-Friendly Interface: Intuitive dashboards make it simple to monitor and manage assets.
- Backed by Experts: Developed by industry leaders committed to innovation and reliability.
Who Should Use This Product?
- Professional Investors: Develop comprehensive and accurate valuation models for portfolio assessment in Samsara Inc. (IOT).
- Corporate Finance Teams: Evaluate valuation scenarios to inform strategic decisions within the organization.
- Consultants and Advisors: Deliver precise valuation insights to clients regarding Samsara Inc. (IOT) stock.
- Students and Educators: Utilize real-time data to practice and teach financial modeling techniques.
- Tech Enthusiasts: Gain insights into the market valuation of innovative IoT companies like Samsara Inc. (IOT).
What the Template Contains
- Operating and Balance Sheet Data: Pre-filled Samsara Inc. (IOT) historical data and forecasts, including revenue, EBITDA, EBIT, and capital expenditures.
- WACC Calculation: A dedicated sheet for Weighted Average Cost of Capital (WACC), including parameters like Beta, risk-free rate, and share price.
- DCF Valuation (Unlevered and Levered): Editable Discounted Cash Flow models showing intrinsic value with detailed calculations.
- Financial Statements: Pre-loaded financial statements (annual and quarterly) to support analysis.
- Key Ratios: Includes profitability, leverage, and efficiency ratios for Samsara Inc. (IOT).
- Dashboard and Charts: Visual summary of valuation outputs and assumptions to analyze results easily.
Disclaimer
All information, articles, and product details provided on this website are for general informational and educational purposes only. We do not claim any ownership over, nor do we intend to infringe upon, any trademarks, copyrights, logos, brand names, or other intellectual property mentioned or depicted on this site. Such intellectual property remains the property of its respective owners, and any references here are made solely for identification or informational purposes, without implying any affiliation, endorsement, or partnership.
We make no representations or warranties, express or implied, regarding the accuracy, completeness, or suitability of any content or products presented. Nothing on this website should be construed as legal, tax, investment, financial, medical, or other professional advice. In addition, no part of this site—including articles or product references—constitutes a solicitation, recommendation, endorsement, advertisement, or offer to buy or sell any securities, franchises, or other financial instruments, particularly in jurisdictions where such activity would be unlawful.
All content is of a general nature and may not address the specific circumstances of any individual or entity. It is not a substitute for professional advice or services. Any actions you take based on the information provided here are strictly at your own risk. You accept full responsibility for any decisions or outcomes arising from your use of this website and agree to release us from any liability in connection with your use of, or reliance upon, the content or products found herein.