
|
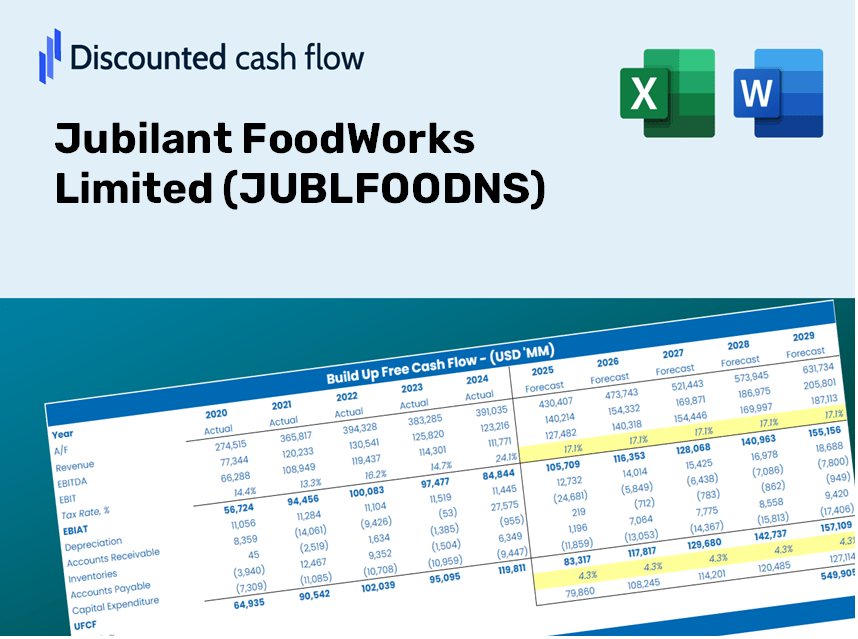
Jubilant Foodworks Limited (JuBlfood.NS) DCF -Bewertung |
Fully Editable: Tailor To Your Needs In Excel Or Sheets
Professional Design: Trusted, Industry-Standard Templates
Investor-Approved Valuation Models
MAC/PC Compatible, Fully Unlocked
No Expertise Is Needed; Easy To Follow
Jubilant FoodWorks Limited (JUBLFOOD.NS) Bundle
Entdecken Sie die finanzielle Zukunft von JuBilant Foodworks Limited (JuBlfoodns) mit unserem benutzerfreundlichen DCF-Taschenrechner! Geben Sie Ihre Annahmen für Wachstum, Margen und Kosten für die Berechnung des inneren Werts von jubelnden FoodWorks Limited (JuBlfoodns) ein und verfeinern Sie Ihre Anlagestrategie.
Discounted Cash Flow (DCF) - (USD MM)
| Year | AY1 2021 |
AY2 2022 |
AY3 2023 |
AY4 2024 |
AY5 2025 |
FY1 2026 |
FY2 2027 |
FY3 2028 |
FY4 2029 |
FY5 2030 |
|---|---|---|---|---|---|---|---|---|---|---|
| Revenue | 33,118.7 | 43,961.2 | 51,582.5 | 56,550.9 | 81,417.3 | 102,520.3 | 129,093.1 | 162,553.5 | 204,686.6 | 257,740.5 |
| Revenue Growth, % | 0 | 32.74 | 17.34 | 9.63 | 43.97 | 25.92 | 25.92 | 25.92 | 25.92 | 25.92 |
| EBITDA | 8,442.7 | 11,428.0 | 12,019.6 | 13,555.3 | 16,431.0 | 24,387.7 | 30,708.9 | 38,668.5 | 48,691.3 | 61,311.8 |
| EBITDA, % | 25.49 | 26 | 23.3 | 23.97 | 20.18 | 23.79 | 23.79 | 23.79 | 23.79 | 23.79 |
| Depreciation | 3,754.0 | 3,930.5 | 4,858.9 | 5,979.6 | 8,065.2 | 10,287.9 | 12,954.5 | 16,312.3 | 20,540.3 | 25,864.3 |
| Depreciation, % | 11.33 | 8.94 | 9.42 | 10.57 | 9.91 | 10.04 | 10.04 | 10.04 | 10.04 | 10.04 |
| EBIT | 4,688.7 | 7,497.5 | 7,160.8 | 7,575.7 | 8,365.8 | 14,099.8 | 17,754.4 | 22,356.3 | 28,150.9 | 35,447.5 |
| EBIT, % | 14.16 | 17.05 | 13.88 | 13.4 | 10.28 | 13.75 | 13.75 | 13.75 | 13.75 | 13.75 |
| Total Cash | 6,205.9 | 6,629.8 | 3,820.6 | 2,547.9 | 2,107.8 | 9,907.7 | 12,475.7 | 15,709.4 | 19,781.2 | 24,908.4 |
| Total Cash, percent | .0 | .0 | .0 | .0 | .0 | .0 | .0 | .0 | .0 | .0 |
| Account Receivables | 168.0 | 220.5 | 287.3 | 2,842.4 | 3,300.7 | 2,182.9 | 2,748.6 | 3,461.1 | 4,358.2 | 5,487.8 |
| Account Receivables, % | 0.50723 | 0.50156 | 0.55699 | 5.03 | 4.05 | 2.13 | 2.13 | 2.13 | 2.13 | 2.13 |
| Inventories | 1,331.3 | 1,611.8 | 1,770.0 | 4,098.9 | 4,056.3 | 4,787.3 | 6,028.1 | 7,590.6 | 9,558.0 | 12,035.4 |
| Inventories, % | 4.02 | 3.67 | 3.43 | 7.25 | 4.98 | 4.67 | 4.67 | 4.67 | 4.67 | 4.67 |
| Accounts Payable | 5,330.2 | 5,369.6 | 5,611.1 | 9,216.5 | 9,009.0 | 13,645.3 | 17,182.1 | 21,635.7 | 27,243.6 | 34,305.0 |
| Accounts Payable, % | 16.09 | 12.21 | 10.88 | 16.3 | 11.07 | 13.31 | 13.31 | 13.31 | 13.31 | 13.31 |
| Capital Expenditure | -2,431.8 | -4,583.8 | -8,420.3 | -8,529.6 | -8,629.2 | -12,256.4 | -15,433.2 | -19,433.4 | -24,470.4 | -30,813.0 |
| Capital Expenditure, % | -7.34 | -10.43 | -16.32 | -15.08 | -10.6 | -11.96 | -11.96 | -11.96 | -11.96 | -11.96 |
| Tax Rate, % | 31.89 | 31.89 | 31.89 | 31.89 | 31.89 | 31.89 | 31.89 | 31.89 | 31.89 | 31.89 |
| EBITAT | 3,547.7 | 5,595.8 | 5,175.0 | 6,228.6 | 5,697.9 | 10,515.5 | 13,241.1 | 16,673.2 | 20,994.8 | 26,436.5 |
| Depreciation | ||||||||||
| Changes in Account Receivables | ||||||||||
| Changes in Inventories | ||||||||||
| Changes in Accounts Payable | ||||||||||
| Capital Expenditure | ||||||||||
| UFCF | 8,700.8 | 4,648.8 | 1,630.1 | 2,399.9 | 4,510.8 | 13,570.3 | 12,492.7 | 15,730.7 | 19,808.1 | 24,942.2 |
| WACC, % | 4.99 | 4.98 | 4.95 | 5.07 | 4.9 | 4.98 | 4.98 | 4.98 | 4.98 | 4.98 |
| PV UFCF | ||||||||||
| SUM PV UFCF | 73,738.2 | |||||||||
| Long Term Growth Rate, % | 4.00 | |||||||||
| Free cash flow (T + 1) | 25,940 | |||||||||
| Terminal Value | 2,658,219 | |||||||||
| Present Terminal Value | 2,085,183 | |||||||||
| Enterprise Value | 2,158,921 | |||||||||
| Net Debt | 42,176 | |||||||||
| Equity Value | 2,116,745 | |||||||||
| Diluted Shares Outstanding, MM | 658 | |||||||||
| Equity Value Per Share | 3,218.74 |
What You Will Receive
- Authentic JUBLFOOD Financial Data: Pre-filled with Jubilant FoodWorks’ historical and projected figures for accurate analysis.
- Fully Customizable Template: Effortlessly adjust key parameters such as revenue growth, WACC, and EBITDA %.
- Instant Calculations: Watch as JUBLFOOD's intrinsic value updates in real-time based on your modifications.
- Professional Valuation Tool: Tailored for investors, analysts, and consultants aiming for precise DCF outcomes.
- User-Friendly Interface: Intuitive layout and clear guidance for users of all experience levels.
Key Features
- Real-Life JUBLFOODNS Data: Pre-filled with Jubilant FoodWorks' historical performance metrics and future projections.
- Fully Customizable Inputs: Modify revenue growth rates, profit margins, discount rates, tax implications, and capital investments.
- Dynamic Valuation Model: Automatically refreshes Net Present Value (NPV) and intrinsic value in response to your adjustments.
- Scenario Testing: Develop various forecasting scenarios to evaluate different valuation results.
- User-Friendly Design: Intuitive layout crafted for both seasoned professionals and newcomers.
How It Works
- Step 1: Download the prebuilt Excel template featuring Jubilant FoodWorks’ data.
- Step 2: Review the filled sheets to familiarize yourself with the essential metrics.
- Step 3: Modify forecasts and assumptions in the editable yellow cells (WACC, growth, margins).
- Step 4: Immediately see the updated results, including the intrinsic value of Jubilant FoodWorks.
- Step 5: Use the outputs to make well-informed investment decisions or create reports.
Why Opt for This Calculator?
- Designed for Experts: A sophisticated tool tailored for analysts, CFOs, and consultants.
- Accurate Data: JUBLFOODNS's historical and projected financials integrated for precision.
- Versatile Scenario Analysis: Effortlessly simulate various forecasts and assumptions.
- Comprehensive Outputs: Instantly computes intrinsic value, NPV, and essential metrics.
- User-Friendly: Step-by-step guidance takes you through each stage of the process.
Who Should Use This Product?
- Investors: Effectively assess the fair value of Jubilant FoodWorks Limited (JUBLFOODNS) prior to making investment choices.
- CFOs: Utilize a high-quality DCF model for comprehensive financial reporting and analysis.
- Consultants: Easily customize the template for client valuation reports.
- Entrepreneurs: Acquire insights into financial modeling practices employed by leading food industry companies.
- Educators: Employ it as a resource for teaching valuation techniques and methodologies.
Contents of the Template
- Pre-Filled Data: Features Jubilant FoodWorks Limited's historical financials and projections.
- Discounted Cash Flow Model: Customizable DCF valuation model with automatic calculations.
- Weighted Average Cost of Capital (WACC): A specific sheet for WACC calculation based on user-defined inputs.
- Key Financial Ratios: Evaluate Jubilant FoodWorks Limited's profitability, operational efficiency, and financial leverage.
- Customizable Inputs: Easily modify revenue growth, profit margins, and tax rates.
- Intuitive Dashboard: Visualizations and tables that summarize essential valuation outcomes.
Disclaimer
All information, articles, and product details provided on this website are for general informational and educational purposes only. We do not claim any ownership over, nor do we intend to infringe upon, any trademarks, copyrights, logos, brand names, or other intellectual property mentioned or depicted on this site. Such intellectual property remains the property of its respective owners, and any references here are made solely for identification or informational purposes, without implying any affiliation, endorsement, or partnership.
We make no representations or warranties, express or implied, regarding the accuracy, completeness, or suitability of any content or products presented. Nothing on this website should be construed as legal, tax, investment, financial, medical, or other professional advice. In addition, no part of this site—including articles or product references—constitutes a solicitation, recommendation, endorsement, advertisement, or offer to buy or sell any securities, franchises, or other financial instruments, particularly in jurisdictions where such activity would be unlawful.
All content is of a general nature and may not address the specific circumstances of any individual or entity. It is not a substitute for professional advice or services. Any actions you take based on the information provided here are strictly at your own risk. You accept full responsibility for any decisions or outcomes arising from your use of this website and agree to release us from any liability in connection with your use of, or reliance upon, the content or products found herein.