
|
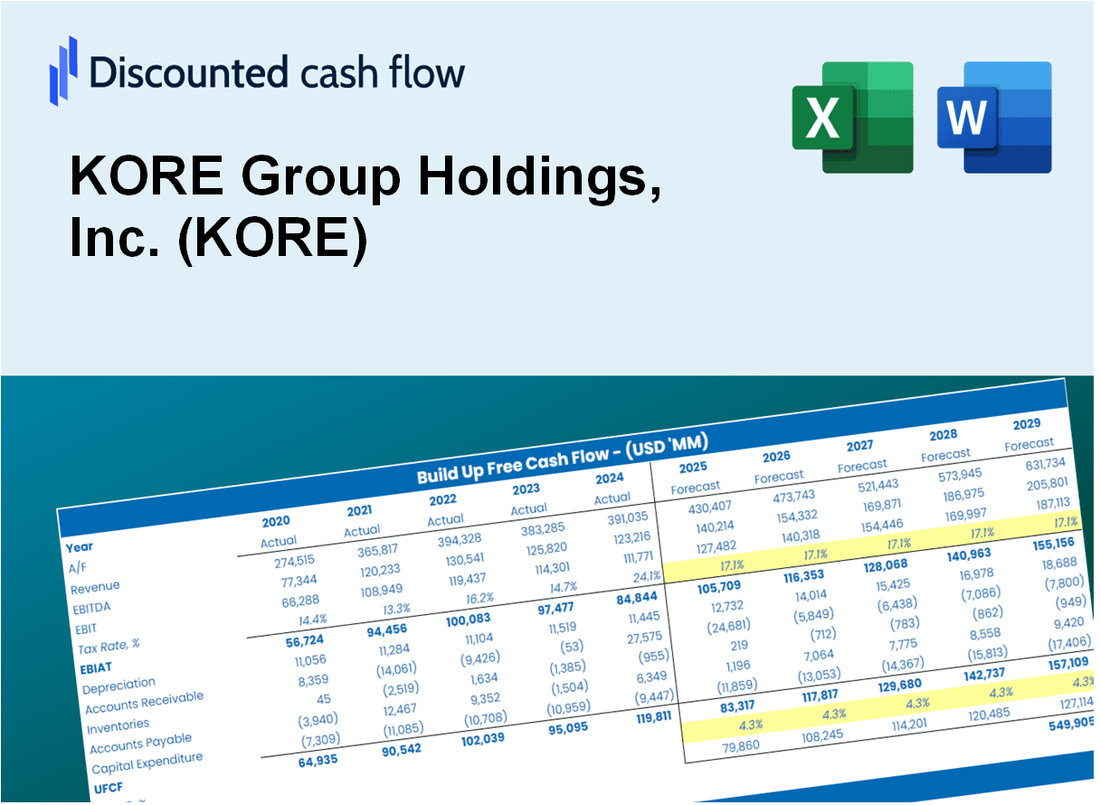
Kore Group Holdings, Inc. (Kore) DCF -Bewertung |
Fully Editable: Tailor To Your Needs In Excel Or Sheets
Professional Design: Trusted, Industry-Standard Templates
Investor-Approved Valuation Models
MAC/PC Compatible, Fully Unlocked
No Expertise Is Needed; Easy To Follow
KORE Group Holdings, Inc. (KORE) Bundle
Als Anleger oder Analyst ist der DCF-Taschenrechner von Kor Group Holdings, Inc. (Kore) Ihre Anlaufstelle für eine genaue Bewertung. Mit realen Daten von Kore-vorinstallierten Daten können Sie problemlos Prognosen anpassen und die Effekte in Echtzeit beobachten.
What You Will Get
- Real KORE Financials: Access to both historical and projected data for precise valuation.
- Customizable Inputs: Adjust WACC, tax rates, revenue growth, and capital expenditures as needed.
- Dynamic Calculations: Intrinsic value and NPV are computed automatically.
- Scenario Analysis: Evaluate various scenarios to assess KORE’s future performance.
- User-Friendly Design: Designed for professionals while remaining approachable for newcomers.
Key Features
- Customizable Forecast Inputs: Adjust essential factors such as revenue projections, EBITDA margins, and capital investments.
- Instant DCF Valuation: Quickly computes intrinsic value, NPV, and additional metrics at the click of a button.
- High-Precision Accuracy: Leverages KORE's actual financial data for credible valuation results.
- Effortless Scenario Analysis: Easily evaluate various assumptions and analyze their impacts side by side.
- Efficiency Booster: Streamline the valuation process by avoiding the complexities of model creation from the ground up.
How It Works
- Download the Template: Get instant access to the Excel-based KORE DCF Calculator.
- Input Your Assumptions: Adjust yellow-highlighted cells for growth rates, WACC, margins, and more.
- Instant Calculations: The model automatically updates KORE’s intrinsic value.
- Test Scenarios: Simulate different assumptions to evaluate potential valuation changes.
- Analyze and Decide: Use the results to guide your investment or financial analysis.
Why Choose This Calculator for KORE Group Holdings, Inc. (KORE)?
- Accurate Data: Access to up-to-date KORE financials guarantees dependable valuation outcomes.
- Customizable: Tailor essential parameters such as growth rates, WACC, and tax rates to align with your forecasts.
- Time-Saving: Pre-configured calculations save you the hassle of building from the ground up.
- Professional-Grade Tool: Created specifically for investors, analysts, and consultants in the KORE sector.
- User-Friendly: Easy-to-navigate design and clear instructions ensure accessibility for all users.
Who Should Use KORE Group Holdings, Inc. (KORE)?
- Technology Students: Explore IoT solutions and apply them to real-world scenarios.
- Researchers: Utilize KORE's data for innovative studies in telecommunications and connectivity.
- Investors: Evaluate your investment strategies and assess the market potential of KORE's offerings.
- Industry Analysts: Enhance your analysis with a comprehensive understanding of KORE's business model.
- Entrepreneurs: Discover insights on how leading companies in the IoT space operate and succeed.
What the Template Contains
- Historical Data: Includes KORE Group Holdings, Inc.’s (KORE) past financials and baseline forecasts.
- DCF and Levered DCF Models: Detailed templates to calculate KORE’s intrinsic value.
- WACC Sheet: Pre-built calculations for Weighted Average Cost of Capital.
- Editable Inputs: Modify key drivers like growth rates, EBITDA %, and CAPEX assumptions.
- Quarterly and Annual Statements: A complete breakdown of KORE’s financials.
- Interactive Dashboard: Visualize valuation results and projections dynamically.
Disclaimer
All information, articles, and product details provided on this website are for general informational and educational purposes only. We do not claim any ownership over, nor do we intend to infringe upon, any trademarks, copyrights, logos, brand names, or other intellectual property mentioned or depicted on this site. Such intellectual property remains the property of its respective owners, and any references here are made solely for identification or informational purposes, without implying any affiliation, endorsement, or partnership.
We make no representations or warranties, express or implied, regarding the accuracy, completeness, or suitability of any content or products presented. Nothing on this website should be construed as legal, tax, investment, financial, medical, or other professional advice. In addition, no part of this site—including articles or product references—constitutes a solicitation, recommendation, endorsement, advertisement, or offer to buy or sell any securities, franchises, or other financial instruments, particularly in jurisdictions where such activity would be unlawful.
All content is of a general nature and may not address the specific circumstances of any individual or entity. It is not a substitute for professional advice or services. Any actions you take based on the information provided here are strictly at your own risk. You accept full responsibility for any decisions or outcomes arising from your use of this website and agree to release us from any liability in connection with your use of, or reliance upon, the content or products found herein.