
|
Lucid Group, Inc. (LCID) DCF -Bewertung |
Fully Editable: Tailor To Your Needs In Excel Or Sheets
Professional Design: Trusted, Industry-Standard Templates
Investor-Approved Valuation Models
MAC/PC Compatible, Fully Unlocked
No Expertise Is Needed; Easy To Follow
Lucid Group, Inc. (LCID) Bundle
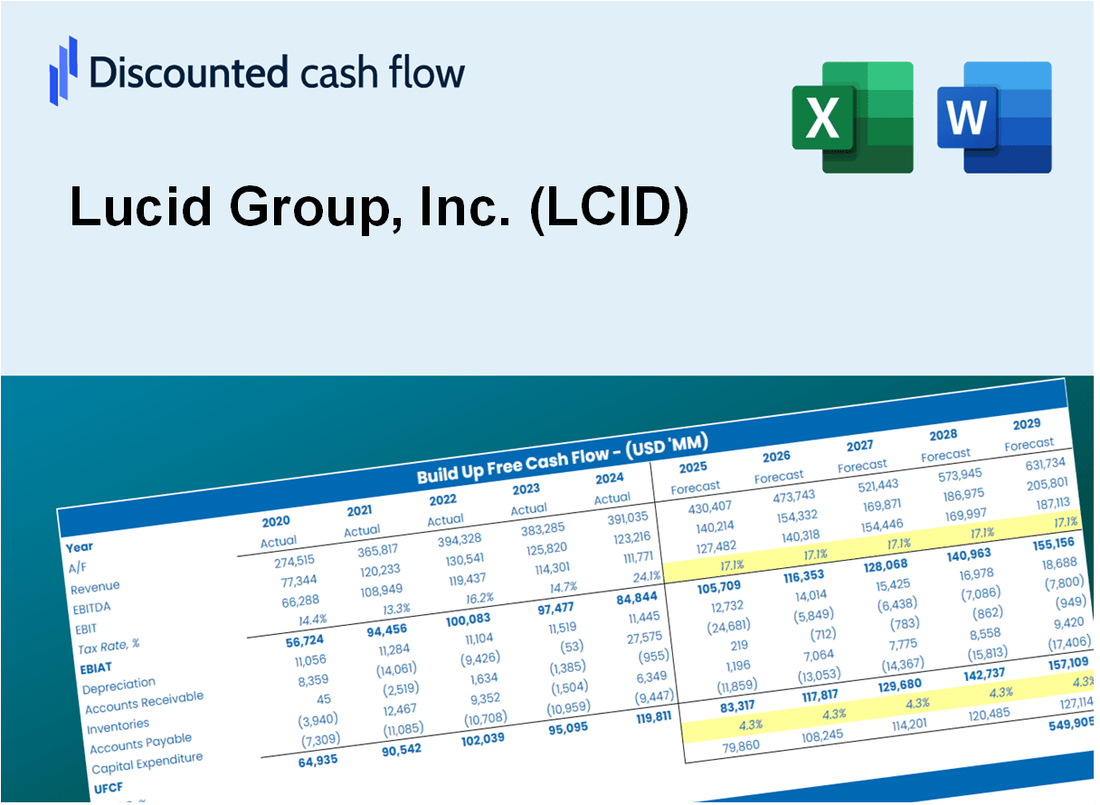
Verbessern Sie Ihre Anlagestrategie mit dem DCF -Taschenrechner der Lucid Group, Inc. (LCID)! Untersuchen Sie die neuesten Finanzdaten für klare, passen Sie Wachstumsprognosen und -kosten an und beobachten Sie die unmittelbaren Auswirkungen auf den [Symbol] intrinsischen Wert.
What You Will Get
- Genuine Lucid Data: Preloaded financials – from revenue to EBIT – based on actual and projected figures for Lucid Group, Inc. (LCID).
- Comprehensive Customization: Modify all essential parameters (yellow cells) such as WACC, growth %, and tax rates to suit your analysis.
- Immediate Valuation Updates: Automatic recalculations to assess the effect of changes on Lucid’s fair value.
- Flexible Excel Template: Designed for quick adjustments, scenario testing, and in-depth projections.
- Efficient and Precise: Avoid the hassle of building models from scratch while ensuring accuracy and adaptability.
Key Features
- Comprehensive Lucid Financials: Gain access to precise historical data and future forecasts tailored for Lucid Group, Inc. (LCID).
- Tailorable Forecast Inputs: Modify highlighted fields such as WACC, growth rates, and profit margins to suit your analysis.
- Real-Time Calculations: Enjoy automatic updates for DCF, Net Present Value (NPV), and cash flow assessments.
- Interactive Dashboard: View intuitive charts and summaries that clearly present your valuation outcomes.
- Designed for All Skill Levels: An easy-to-navigate layout crafted for investors, CFOs, and consultants alike.
How It Works
- Step 1: Download the prebuilt Excel template with Lucid Group’s (LCID) data included.
- Step 2: Explore the pre-filled sheets and familiarize yourself with the key metrics.
- Step 3: Update forecasts and assumptions in the editable yellow cells (WACC, growth, margins).
- Step 4: Instantly view recalculated results, including Lucid Group’s intrinsic value.
- Step 5: Make informed investment decisions or generate reports using the outputs.
Why Choose This Calculator for Lucid Group, Inc. (LCID)?
- Accurate Data: Up-to-date Lucid financials provide trustworthy valuation outcomes.
- Customizable: Modify essential parameters such as growth rates, WACC, and tax rates to align with your forecasts.
- Time-Saving: Pre-configured calculations save you the effort of starting from the ground up.
- Professional-Grade Tool: Tailored for investors, analysts, and consultants in the automotive sector.
- User-Friendly: Easy-to-navigate design and clear instructions make it accessible for everyone.
Who Should Use This Product?
- Professional Investors: Develop comprehensive and accurate valuation models for portfolio assessments of Lucid Group, Inc. (LCID).
- Corporate Finance Teams: Evaluate valuation scenarios to inform strategic decisions within their organizations.
- Consultants and Advisors: Deliver precise valuation insights for clients interested in Lucid Group, Inc. (LCID).
- Students and Educators: Utilize real-world data to enhance learning and practice in financial modeling.
- Automotive Enthusiasts: Gain insights into how electric vehicle companies like Lucid Group, Inc. (LCID) are valued in the marketplace.
What the Template Contains
- Pre-Filled Data: Includes Lucid Group, Inc.'s (LCID) historical financials and projections.
- Discounted Cash Flow Model: Editable DCF valuation model featuring automatic calculations.
- Weighted Average Cost of Capital (WACC): A dedicated sheet for calculating WACC based on user-defined inputs.
- Key Financial Ratios: Evaluate Lucid Group, Inc.'s (LCID) profitability, efficiency, and leverage.
- Customizable Inputs: Easily modify revenue growth, margins, and tax rates.
- Clear Dashboard: Visualizations and tables summarizing essential valuation outcomes.
Disclaimer
All information, articles, and product details provided on this website are for general informational and educational purposes only. We do not claim any ownership over, nor do we intend to infringe upon, any trademarks, copyrights, logos, brand names, or other intellectual property mentioned or depicted on this site. Such intellectual property remains the property of its respective owners, and any references here are made solely for identification or informational purposes, without implying any affiliation, endorsement, or partnership.
We make no representations or warranties, express or implied, regarding the accuracy, completeness, or suitability of any content or products presented. Nothing on this website should be construed as legal, tax, investment, financial, medical, or other professional advice. In addition, no part of this site—including articles or product references—constitutes a solicitation, recommendation, endorsement, advertisement, or offer to buy or sell any securities, franchises, or other financial instruments, particularly in jurisdictions where such activity would be unlawful.
All content is of a general nature and may not address the specific circumstances of any individual or entity. It is not a substitute for professional advice or services. Any actions you take based on the information provided here are strictly at your own risk. You accept full responsibility for any decisions or outcomes arising from your use of this website and agree to release us from any liability in connection with your use of, or reliance upon, the content or products found herein.