
|
Leslie's, Inc. (LESL) DCF -Bewertung |
Fully Editable: Tailor To Your Needs In Excel Or Sheets
Professional Design: Trusted, Industry-Standard Templates
Investor-Approved Valuation Models
MAC/PC Compatible, Fully Unlocked
No Expertise Is Needed; Easy To Follow
Leslie's, Inc. (LESL) Bundle
Unabhängig davon, ob Sie ein Anleger oder Analyst sind, ist dieser (LESL) DCF-Taschenrechner Ihre Anlaufstelle für eine genaue Bewertung. Mit echten Daten von Leslie's, Inc. können Sie Prognosen anpassen und die Auswirkungen sofort beobachten.
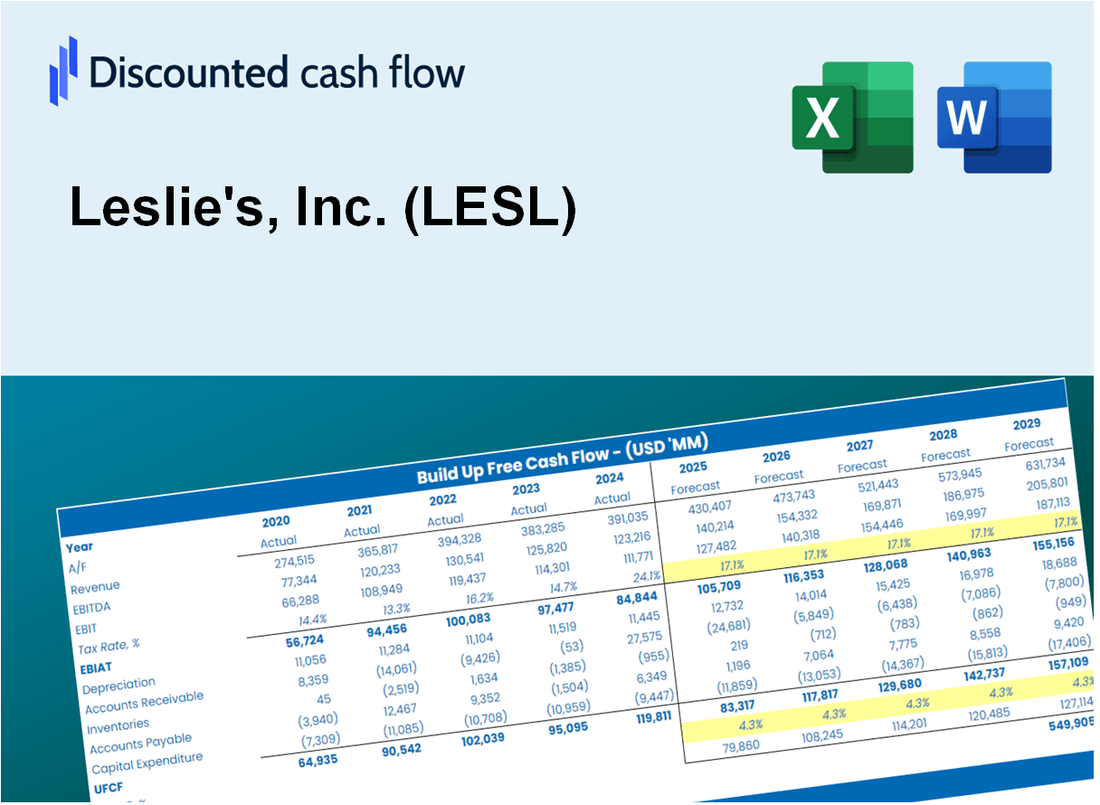
Discounted Cash Flow (DCF) - (USD MM)
| Year | AY1 2020 |
AY2 2021 |
AY3 2022 |
AY4 2023 |
AY5 2024 |
FY1 2025 |
FY2 2026 |
FY3 2027 |
FY4 2028 |
FY5 2029 |
|---|---|---|---|---|---|---|---|---|---|---|
| Revenue | 1,112.2 | 1,342.9 | 1,562.1 | 1,451.2 | 1,330.1 | 1,402.0 | 1,477.8 | 1,557.7 | 1,641.9 | 1,730.6 |
| Revenue Growth, % | 0 | 20.74 | 16.32 | -7.1 | -8.34 | 5.4 | 5.4 | 5.4 | 5.4 | 5.4 |
| EBITDA | 176.8 | 224.1 | 269.1 | 136.3 | 90.2 | 185.0 | 195.0 | 205.6 | 216.7 | 228.4 |
| EBITDA, % | 15.9 | 16.69 | 17.23 | 9.39 | 6.78 | 13.2 | 13.2 | 13.2 | 13.2 | 13.2 |
| Depreciation | 31.5 | 26.6 | 30.8 | 34.1 | 33.1 | 32.6 | 34.3 | 36.2 | 38.2 | 40.2 |
| Depreciation, % | 2.83 | 1.98 | 1.97 | 2.35 | 2.49 | 2.32 | 2.32 | 2.32 | 2.32 | 2.32 |
| EBIT | 145.3 | 197.5 | 238.4 | 102.2 | 57.1 | 152.4 | 160.7 | 169.4 | 178.5 | 188.2 |
| EBIT, % | 13.06 | 14.71 | 15.26 | 7.04 | 4.29 | 10.87 | 10.87 | 10.87 | 10.87 | 10.87 |
| Total Cash | 157.1 | 345.1 | 112.3 | 55.4 | 108.5 | 165.4 | 174.3 | 183.7 | 193.7 | 204.1 |
| Total Cash, percent | .0 | .0 | .0 | .0 | .0 | .0 | .0 | .0 | .0 | .0 |
| Account Receivables | 31.5 | 38.9 | 45.3 | 29.4 | 45.5 | 39.4 | 41.6 | 43.8 | 46.2 | 48.7 |
| Account Receivables, % | 2.83 | 2.89 | 2.9 | 2.03 | 3.42 | 2.81 | 2.81 | 2.81 | 2.81 | 2.81 |
| Inventories | 149.0 | 198.8 | 361.7 | 311.8 | 234.3 | 253.6 | 267.3 | 281.8 | 297.0 | 313.1 |
| Inventories, % | 13.39 | 14.8 | 23.15 | 21.49 | 17.61 | 18.09 | 18.09 | 18.09 | 18.09 | 18.09 |
| Accounts Payable | 92.4 | 101.0 | 156.5 | 58.6 | 67.6 | 98.0 | 103.3 | 108.9 | 114.8 | 121.0 |
| Accounts Payable, % | 8.31 | 7.52 | 10.02 | 4.03 | 5.08 | 6.99 | 6.99 | 6.99 | 6.99 | 6.99 |
| Capital Expenditure | -20.6 | -28.9 | -31.7 | -38.6 | -47.2 | -34.4 | -36.2 | -38.2 | -40.2 | -42.4 |
| Capital Expenditure, % | -1.85 | -2.15 | -2.03 | -2.66 | -3.55 | -2.45 | -2.45 | -2.45 | -2.45 | -2.45 |
| Tax Rate, % | -76.07 | -76.07 | -76.07 | -76.07 | -76.07 | -76.07 | -76.07 | -76.07 | -76.07 | -76.07 |
| EBITAT | 139.0 | 153.3 | 182.1 | 75.8 | 100.6 | 129.2 | 136.2 | 143.6 | 151.3 | 159.5 |
| Depreciation | ||||||||||
| Changes in Account Receivables | ||||||||||
| Changes in Inventories | ||||||||||
| Changes in Accounts Payable | ||||||||||
| Capital Expenditure | ||||||||||
| UFCF | 61.9 | 102.4 | 67.3 | 39.2 | 157.0 | 144.6 | 123.8 | 130.5 | 137.6 | 145.0 |
| WACC, % | 6.51 | 5.33 | 5.25 | 5.1 | 6.79 | 5.8 | 5.8 | 5.8 | 5.8 | 5.8 |
| PV UFCF | ||||||||||
| SUM PV UFCF | 576.7 | |||||||||
| Long Term Growth Rate, % | 0.50 | |||||||||
| Free cash flow (T + 1) | 146 | |||||||||
| Terminal Value | 2,752 | |||||||||
| Present Terminal Value | 2,077 | |||||||||
| Enterprise Value | 2,653 | |||||||||
| Net Debt | 941 | |||||||||
| Equity Value | 1,712 | |||||||||
| Diluted Shares Outstanding, MM | 9 | |||||||||
| Equity Value Per Share | 185.41 |
What You Will Receive
- Genuine LESL Financial Data: Pre-filled with Leslie's historical and forecasted data for accurate analysis.
- Completely Customizable Template: Easily adjust key inputs such as revenue growth, WACC, and EBITDA %.
- Instant Calculations: Watch Leslie's intrinsic value update in real-time as you make changes.
- Expert Valuation Tool: Tailored for investors, analysts, and consultants aiming for precise DCF results.
- Intuitive Design: Streamlined layout and straightforward instructions suitable for all skill levels.
Key Features
- Pre-Loaded Data: Leslie's, Inc.'s historical financial statements and pre-filled forecasts.
- Fully Adjustable Inputs: Modify WACC, tax rates, revenue growth, and EBITDA margins as needed.
- Instant Results: View Leslie's intrinsic value recalculating in real time.
- Clear Visual Outputs: Dashboard charts illustrate valuation results and key metrics.
- Built for Accuracy: A professional tool tailored for analysts, investors, and finance experts.
How It Works
- Step 1: Download the prebuilt Excel template featuring Leslie's, Inc. (LESL) data.
- Step 2: Navigate through the pre-filled sheets to familiarize yourself with key performance indicators.
- Step 3: Modify forecasts and assumptions in the editable yellow cells (WACC, growth, margins).
- Step 4: Instantly view updated results, including Leslie's, Inc. (LESL) intrinsic value.
- Step 5: Utilize the outputs to make informed investment choices or create detailed reports.
Why Choose This Calculator?
- Accurate Data: Real Leslie's, Inc. (LESL) financials ensure reliable valuation results.
- Customizable: Adjust key parameters like growth rates, WACC, and tax rates to match your projections.
- Time-Saving: Pre-built calculations eliminate the need to start from scratch.
- Professional-Grade Tool: Designed for investors, analysts, and consultants.
- User-Friendly: Intuitive layout and step-by-step instructions make it easy for all users.
Who Should Use This Product?
- Finance Students: Master financial modeling techniques and apply them to real-world data.
- Academics: Utilize comprehensive models for teaching or research purposes.
- Investors: Validate your investment strategies and assess valuation results for Leslie's, Inc. (LESL).
- Analysts: Enhance your analysis process with a ready-to-use, customizable DCF model.
- Small Business Owners: Understand the valuation methods used for large public companies like Leslie's, Inc. (LESL).
What the Template Contains
- Preloaded LESL Data: Historical and projected financial data, including revenue, EBIT, and capital expenditures.
- DCF and WACC Models: Professional-grade sheets for calculating intrinsic value and Weighted Average Cost of Capital.
- Editable Inputs: Yellow-highlighted cells for adjusting revenue growth, tax rates, and discount rates.
- Financial Statements: Comprehensive annual and quarterly financials for deeper analysis.
- Key Ratios: Profitability, leverage, and efficiency ratios to evaluate performance.
- Dashboard and Charts: Visual summaries of valuation outcomes and assumptions.
Disclaimer
All information, articles, and product details provided on this website are for general informational and educational purposes only. We do not claim any ownership over, nor do we intend to infringe upon, any trademarks, copyrights, logos, brand names, or other intellectual property mentioned or depicted on this site. Such intellectual property remains the property of its respective owners, and any references here are made solely for identification or informational purposes, without implying any affiliation, endorsement, or partnership.
We make no representations or warranties, express or implied, regarding the accuracy, completeness, or suitability of any content or products presented. Nothing on this website should be construed as legal, tax, investment, financial, medical, or other professional advice. In addition, no part of this site—including articles or product references—constitutes a solicitation, recommendation, endorsement, advertisement, or offer to buy or sell any securities, franchises, or other financial instruments, particularly in jurisdictions where such activity would be unlawful.
All content is of a general nature and may not address the specific circumstances of any individual or entity. It is not a substitute for professional advice or services. Any actions you take based on the information provided here are strictly at your own risk. You accept full responsibility for any decisions or outcomes arising from your use of this website and agree to release us from any liability in connection with your use of, or reliance upon, the content or products found herein.