
|
Die DCF -Bewertung der Marygold Companies, Inc. (MGLD) |
Fully Editable: Tailor To Your Needs In Excel Or Sheets
Professional Design: Trusted, Industry-Standard Templates
Investor-Approved Valuation Models
MAC/PC Compatible, Fully Unlocked
No Expertise Is Needed; Easy To Follow
The Marygold Companies, Inc. (MGLD) Bundle
Unser (MGLD) DCF -Taschenrechner (MGLD) ermöglicht es Ihnen, die Bewertung von Marygold Companies, Inc. anhand umfassender Finanzdaten zu bewerten, und bietet vollständige Flexibilität, um alle Schlüsselparameter für erweiterte Projektionen zu ändern.
What You Will Get
- Editable Excel Template: A fully customizable Excel-based DCF Calculator featuring pre-filled financials for The Marygold Companies, Inc. (MGLD).
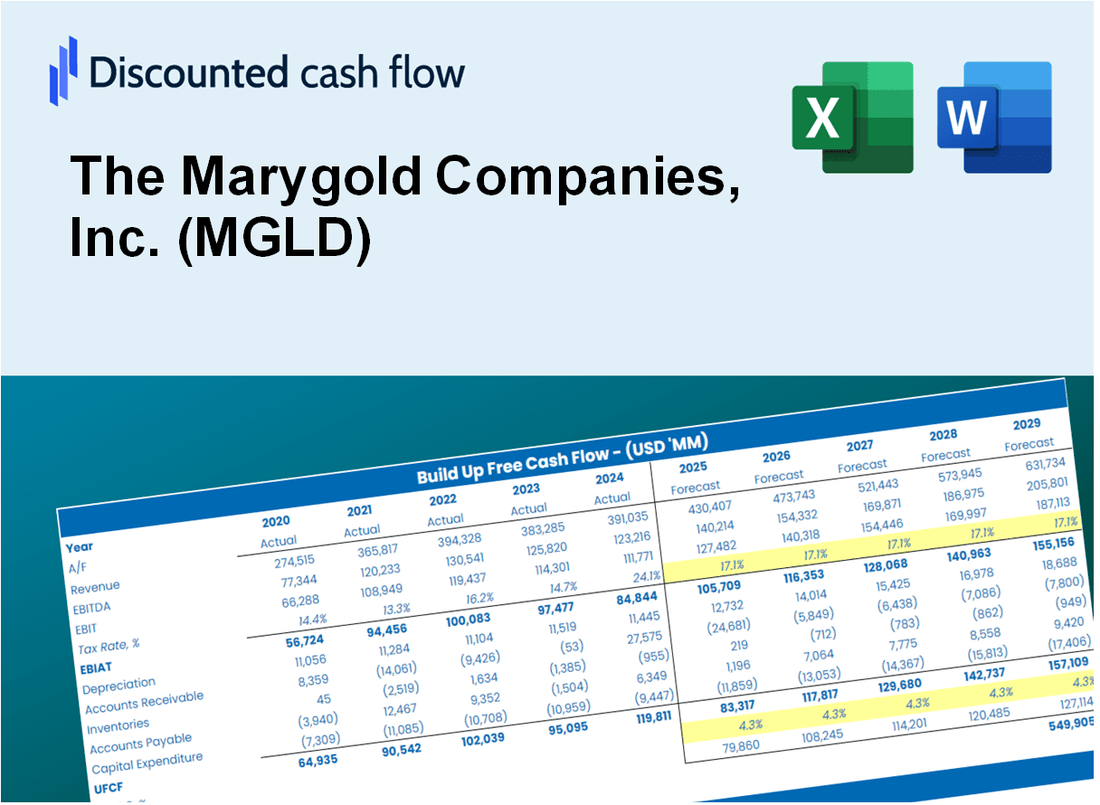
- Real-World Data: Access to historical data and forward-looking estimates (highlighted in the yellow cells).
- Forecast Flexibility: Adjust forecast assumptions such as revenue growth, EBITDA %, and WACC.
- Automatic Calculations: Instantly observe the effect of your inputs on The Marygold Companies, Inc. (MGLD)'s valuation.
- Professional Tool: Designed for investors, CFOs, consultants, and financial analysts.
- User-Friendly Design: Organized for clarity and ease of use, complete with step-by-step instructions.
Key Features
- Comprehensive Data: The Marygold Companies, Inc. (MGLD) historical financial statements and projected forecasts included.
- Customizable Parameters: Adjust inputs for WACC, tax rates, revenue growth, and EBITDA margins as needed.
- Real-Time Insights: View the intrinsic value of The Marygold Companies, Inc. (MGLD) update instantly.
- Intuitive Visualizations: Dashboard graphs illustrate valuation outcomes and essential metrics clearly.
- Designed for Precision: A reliable tool tailored for analysts, investors, and financial professionals.
How It Works
- 1. Access the Template: Download and open the Excel file containing The Marygold Companies, Inc. (MGLD) preloaded data.
- 2. Adjust Assumptions: Modify essential inputs such as growth rates, WACC, and capital expenditures.
- 3. View Results Instantly: The DCF model automatically calculates intrinsic value and NPV in real-time.
- 4. Explore Scenarios: Analyze various forecasts to evaluate different valuation outcomes.
- 5. Present with Confidence: Deliver professional valuation insights to bolster your decision-making.
Why Choose This Calculator for The Marygold Companies, Inc. (MGLD)?
- Designed for Experts: A sophisticated tool tailored for analysts, financial officers, and consultants.
- Comprehensive Data: The Marygold Companies' historical and projected financials are preloaded for precise analysis.
- Flexible Scenario Analysis: Effortlessly simulate various forecasts and assumptions.
- Insightful Outputs: Instantly computes intrinsic value, NPV, and other essential metrics.
- User-Friendly Interface: Step-by-step guidance ensures a smooth experience throughout the process.
Who Should Use This Product?
- Investors: Evaluate The Marygold Companies, Inc.'s (MGLD) performance before making investment decisions.
- CFOs and Financial Analysts: Enhance valuation methodologies and assess financial forecasts for MGLD.
- Startup Founders: Understand the valuation strategies of established companies like The Marygold Companies, Inc. (MGLD).
- Consultants: Provide detailed valuation analyses and reports for clients involving MGLD.
- Students and Educators: Utilize real-time data from The Marygold Companies, Inc. (MGLD) to practice and teach valuation concepts.
What the Template Contains
- Historical Data: Includes The Marygold Companies, Inc.'s (MGLD) past financials and baseline forecasts.
- DCF and Levered DCF Models: Detailed templates to calculate The Marygold Companies, Inc.'s (MGLD) intrinsic value.
- WACC Sheet: Pre-built calculations for Weighted Average Cost of Capital.
- Editable Inputs: Modify key drivers like growth rates, EBITDA %, and CAPEX assumptions.
- Quarterly and Annual Statements: A complete breakdown of The Marygold Companies, Inc.'s (MGLD) financials.
- Interactive Dashboard: Visualize valuation results and projections dynamically.
Disclaimer
All information, articles, and product details provided on this website are for general informational and educational purposes only. We do not claim any ownership over, nor do we intend to infringe upon, any trademarks, copyrights, logos, brand names, or other intellectual property mentioned or depicted on this site. Such intellectual property remains the property of its respective owners, and any references here are made solely for identification or informational purposes, without implying any affiliation, endorsement, or partnership.
We make no representations or warranties, express or implied, regarding the accuracy, completeness, or suitability of any content or products presented. Nothing on this website should be construed as legal, tax, investment, financial, medical, or other professional advice. In addition, no part of this site—including articles or product references—constitutes a solicitation, recommendation, endorsement, advertisement, or offer to buy or sell any securities, franchises, or other financial instruments, particularly in jurisdictions where such activity would be unlawful.
All content is of a general nature and may not address the specific circumstances of any individual or entity. It is not a substitute for professional advice or services. Any actions you take based on the information provided here are strictly at your own risk. You accept full responsibility for any decisions or outcomes arising from your use of this website and agree to release us from any liability in connection with your use of, or reliance upon, the content or products found herein.