
|
Mirum Pharmaceuticals, Inc. (MIRM) DCF -Bewertung |
Fully Editable: Tailor To Your Needs In Excel Or Sheets
Professional Design: Trusted, Industry-Standard Templates
Investor-Approved Valuation Models
MAC/PC Compatible, Fully Unlocked
No Expertise Is Needed; Easy To Follow
Mirum Pharmaceuticals, Inc. (MIRM) Bundle
Stürzen Sie Ihre Analyse und steigern Sie die Präzision mit unserem (MIRM) DCF -Taschenrechner! Ausgestattet mit echten Daten von Mirum Pharmaceuticals und anpassbaren Annahmen ermöglichen Sie, dass Sie wie ein erfahrener Investor prognostizieren, analysieren und value (MIRM) haben.
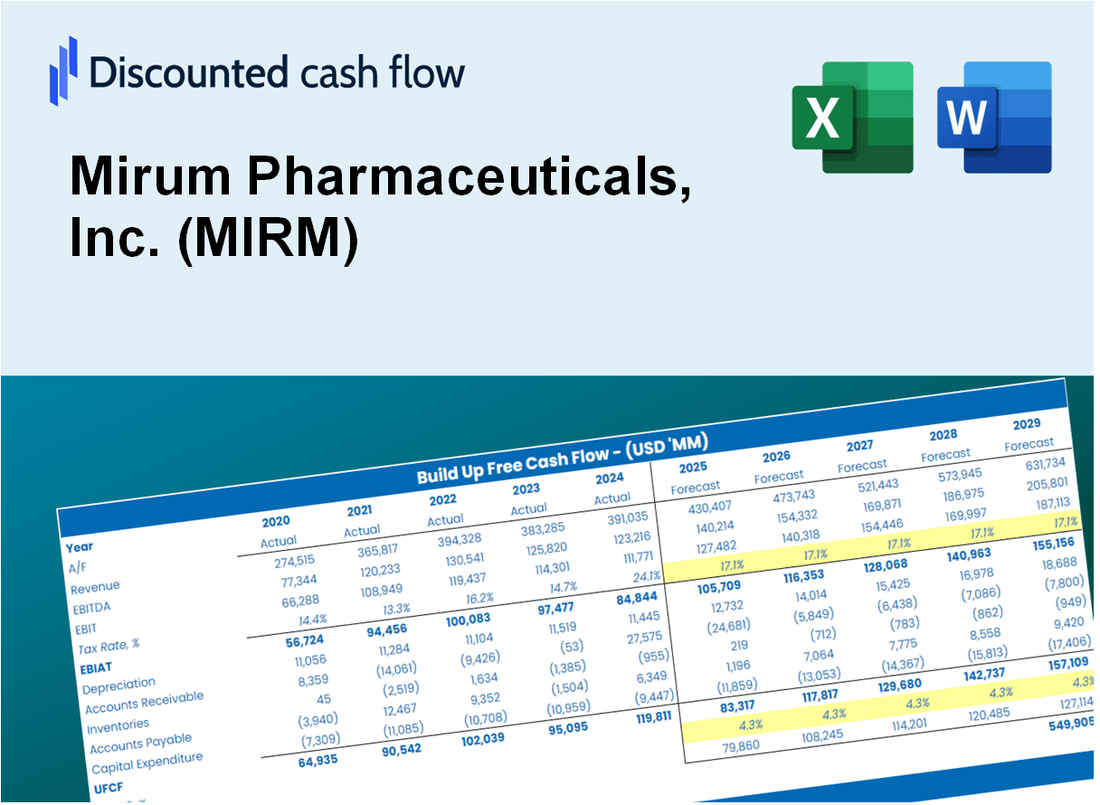
Discounted Cash Flow (DCF) - (USD MM)
| Year | AY1 2020 |
AY2 2021 |
AY3 2022 |
AY4 2023 |
AY5 2024 |
FY1 2025 |
FY2 2026 |
FY3 2027 |
FY4 2028 |
FY5 2029 |
|---|---|---|---|---|---|---|---|---|---|---|
| Revenue | .0 | 19.1 | 77.1 | 186.4 | 336.9 | 573.3 | 975.8 | 1,660.7 | 2,826.3 | 4,810.1 |
| Revenue Growth, % | 0 | 0 | 302.66 | 141.85 | 80.76 | 70.19 | 70.19 | 70.19 | 70.19 | 70.19 |
| EBITDA | -102.3 | -65.4 | -122.9 | -136.5 | -49.0 | -215.3 | -366.4 | -623.7 | -1,061.4 | -1,806.4 |
| EBITDA, % | 100 | -341.66 | -159.42 | -73.23 | -14.54 | -37.55 | -37.55 | -37.55 | -37.55 | -37.55 |
| Depreciation | .6 | 1.0 | 3.2 | 10.8 | 23.6 | 140.0 | 238.3 | 405.6 | 690.3 | 1,174.8 |
| Depreciation, % | 100 | 5.09 | 4.2 | 5.81 | 7.01 | 24.42 | 24.42 | 24.42 | 24.42 | 24.42 |
| EBIT | -102.9 | -66.4 | -126.1 | -147.3 | -72.6 | -230.0 | -391.5 | -666.2 | -1,133.9 | -1,929.8 |
| EBIT, % | 100 | -346.75 | -163.62 | -79.04 | -21.55 | -40.12 | -40.12 | -40.12 | -40.12 | -40.12 |
| Total Cash | 231.8 | 156.5 | 151.7 | 286.3 | 280.3 | 554.1 | 943.0 | 1,604.9 | 2,731.4 | 4,648.5 |
| Total Cash, percent | .0 | .0 | .0 | .0 | .0 | .0 | .0 | .0 | .0 | .0 |
| Account Receivables | .0 | 3.3 | 24.0 | 68.0 | 78.3 | 238.4 | 405.8 | 690.6 | 1,175.3 | 2,000.2 |
| Account Receivables, % | 100 | 17.07 | 31.14 | 36.47 | 23.24 | 41.58 | 41.58 | 41.58 | 41.58 | 41.58 |
| Inventories | .0 | 1.5 | 5.6 | 22.3 | 22.4 | 153.4 | 261.0 | 444.2 | 756.0 | 1,286.7 |
| Inventories, % | 100 | 7.91 | 7.22 | 11.97 | 6.65 | 26.75 | 26.75 | 26.75 | 26.75 | 26.75 |
| Accounts Payable | 3.2 | 9.2 | 8.7 | 7.4 | 14.6 | 192.1 | 326.9 | 556.3 | 946.8 | 1,611.3 |
| Accounts Payable, % | 100 | 47.89 | 11.28 | 3.98 | 4.34 | 33.5 | 33.5 | 33.5 | 33.5 | 33.5 |
| Capital Expenditure | -.2 | -19.0 | -.3 | -20.1 | -1.0 | -127.1 | -216.3 | -368.2 | -626.6 | -1,066.4 |
| Capital Expenditure, % | 100 | -99.4 | -0.36075 | -10.79 | -0.29476 | -22.17 | -22.17 | -22.17 | -22.17 | -22.17 |
| Tax Rate, % | -1.19 | -1.19 | -1.19 | -1.19 | -1.19 | -1.19 | -1.19 | -1.19 | -1.19 | -1.19 |
| EBITAT | -102.9 | -66.4 | -120.4 | -148.2 | -73.5 | -227.9 | -387.9 | -660.2 | -1,123.7 | -1,912.4 |
| Depreciation | ||||||||||
| Changes in Account Receivables | ||||||||||
| Changes in Inventories | ||||||||||
| Changes in Accounts Payable | ||||||||||
| Capital Expenditure | ||||||||||
| UFCF | -99.4 | -83.2 | -142.7 | -219.5 | -54.0 | -328.7 | -506.1 | -861.4 | -1,466.0 | -2,495.0 |
| WACC, % | 5.63 | 5.63 | 5.61 | 5.63 | 5.63 | 5.63 | 5.63 | 5.63 | 5.63 | 5.63 |
| PV UFCF | ||||||||||
| SUM PV UFCF | -4,570.9 | |||||||||
| Long Term Growth Rate, % | 2.00 | |||||||||
| Free cash flow (T + 1) | -2,545 | |||||||||
| Terminal Value | -70,154 | |||||||||
| Present Terminal Value | -53,354 | |||||||||
| Enterprise Value | -57,924 | |||||||||
| Net Debt | 95 | |||||||||
| Equity Value | -58,020 | |||||||||
| Diluted Shares Outstanding, MM | 48 | |||||||||
| Equity Value Per Share | -1,220.88 |
What You Will Receive
- Customizable Excel Template: A fully adaptable Excel-based DCF Calculator featuring pre-filled real MIRM financials.
- Actual Market Data: Historical performance data and forward-looking estimates (highlighted in the yellow cells).
- Adjustable Forecasts: Modify forecast assumptions such as revenue growth, EBITDA %, and WACC.
- Instant Calculations: Quickly observe how your inputs affect Mirum Pharmaceuticals’ valuation.
- Professional Grade Tool: Designed for investors, CFOs, consultants, and financial analysts.
- Intuitive Design: Organized for clarity and ease of use, complete with step-by-step guidance.
Key Features
- Customizable Clinical Parameters: Adjust essential inputs such as drug efficacy rates, development timelines, and market penetration.
- Instant DCF Valuation: Automatically computes intrinsic value, NPV, and other financial metrics in real-time.
- High-Precision Analysis: Leverages Mirum Pharmaceuticals' actual financial data for accurate valuation results.
- Effortless Scenario Testing: Evaluate various assumptions and analyze outcomes with ease.
- Efficiency Booster: Streamlines the valuation process by removing the need for intricate model construction.
How It Works
- Download the Template: Gain immediate access to the Excel-based MIRM DCF Calculator.
- Input Your Assumptions: Modify the yellow-highlighted cells for growth rates, WACC, margins, and additional factors.
- Instant Calculations: The model automatically recalculates Mirum Pharmaceuticals' intrinsic value.
- Test Scenarios: Experiment with various assumptions to assess potential changes in valuation.
- Analyze and Decide: Utilize the outcomes to inform your investment or financial decisions.
Why Choose This Calculator for Mirum Pharmaceuticals (MIRM)?
- User-Friendly Interface: Tailored for both novice and experienced users.
- Customizable Inputs: Adjust parameters easily to suit your financial analysis.
- Real-Time Valuation: Witness immediate updates to Mirum’s valuation as you modify inputs.
- Preloaded Data: Comes with Mirum’s actual financial information for swift evaluations.
- Preferred by Experts: Utilized by financial analysts and investors for strategic decision-making.
Who Should Use This Product?
- Healthcare Investors: Develop comprehensive valuation models for assessing Mirum Pharmaceuticals, Inc. (MIRM) investments.
- Pharmaceutical Finance Teams: Evaluate valuation scenarios to inform strategic decisions within the company.
- Consultants and Advisors: Offer clients precise valuation insights for Mirum Pharmaceuticals, Inc. (MIRM) stock.
- Students and Educators: Utilize real-world data to practice and teach financial modeling in the biotech sector.
- Biotech Enthusiasts: Gain insights into how biotech companies like Mirum Pharmaceuticals, Inc. (MIRM) are valued in the market.
What the Template Contains
- Preloaded MIRM Data: Historical and projected financial data, including revenue, EBIT, and capital expenditures.
- DCF and WACC Models: Professional-grade sheets for calculating intrinsic value and Weighted Average Cost of Capital.
- Editable Inputs: Yellow-highlighted cells for adjusting revenue growth, tax rates, and discount rates.
- Financial Statements: Comprehensive annual and quarterly financials for deeper analysis.
- Key Ratios: Profitability, leverage, and efficiency ratios to evaluate performance.
- Dashboard and Charts: Visual summaries of valuation outcomes and assumptions.
Disclaimer
All information, articles, and product details provided on this website are for general informational and educational purposes only. We do not claim any ownership over, nor do we intend to infringe upon, any trademarks, copyrights, logos, brand names, or other intellectual property mentioned or depicted on this site. Such intellectual property remains the property of its respective owners, and any references here are made solely for identification or informational purposes, without implying any affiliation, endorsement, or partnership.
We make no representations or warranties, express or implied, regarding the accuracy, completeness, or suitability of any content or products presented. Nothing on this website should be construed as legal, tax, investment, financial, medical, or other professional advice. In addition, no part of this site—including articles or product references—constitutes a solicitation, recommendation, endorsement, advertisement, or offer to buy or sell any securities, franchises, or other financial instruments, particularly in jurisdictions where such activity would be unlawful.
All content is of a general nature and may not address the specific circumstances of any individual or entity. It is not a substitute for professional advice or services. Any actions you take based on the information provided here are strictly at your own risk. You accept full responsibility for any decisions or outcomes arising from your use of this website and agree to release us from any liability in connection with your use of, or reliance upon, the content or products found herein.