
|
Monro, Inc. (MNRO) DCF -Bewertung |
Fully Editable: Tailor To Your Needs In Excel Or Sheets
Professional Design: Trusted, Industry-Standard Templates
Investor-Approved Valuation Models
MAC/PC Compatible, Fully Unlocked
No Expertise Is Needed; Easy To Follow
Monro, Inc. (MNRO) Bundle
Vereinfachen Sie die Bewertung von Monro, Inc. (MNRO) mit diesem anpassbaren DCF -Taschenrechner! Mit Real Monro, Inc. (MNRO) -Befinanzierungen und einstellbaren Prognoseeingaben können Sie Szenarien testen und Monro, Inc. (MNRO) in Minuten aufdecken.
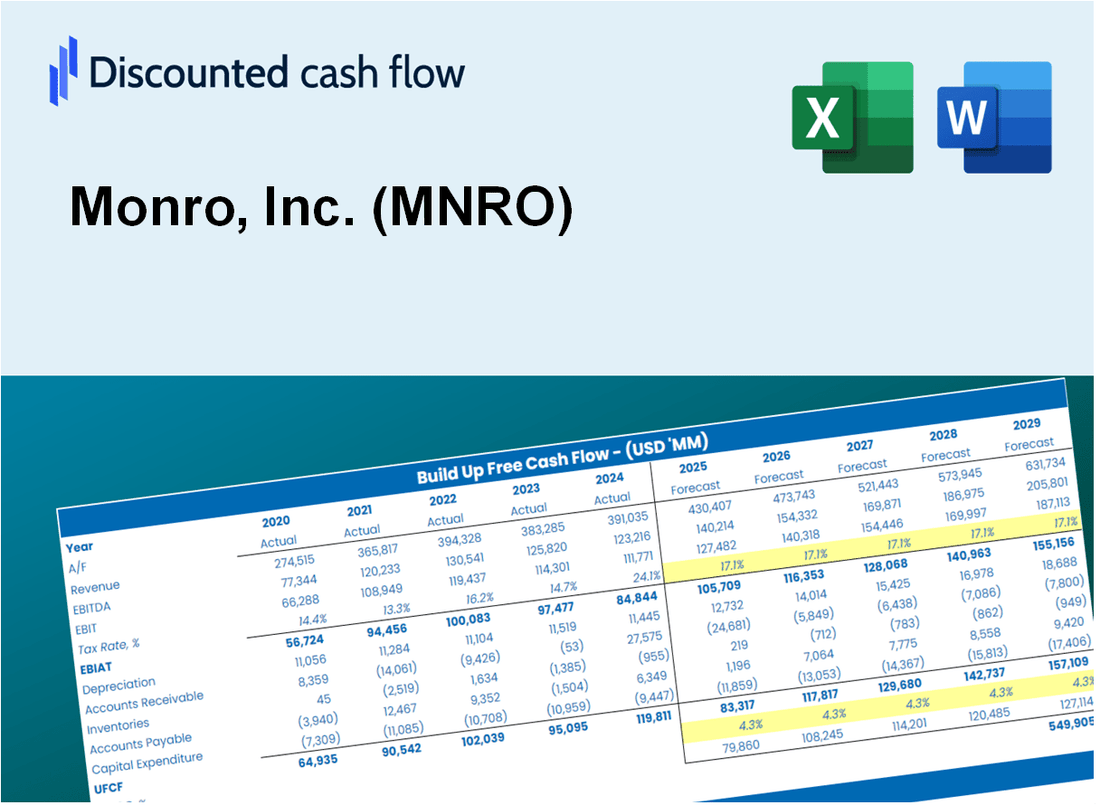
Discounted Cash Flow (DCF) - (USD MM)
| Year | AY1 2021 |
AY2 2022 |
AY3 2023 |
AY4 2024 |
AY5 2025 |
FY1 2026 |
FY2 2027 |
FY3 2028 |
FY4 2029 |
FY5 2030 |
|---|---|---|---|---|---|---|---|---|---|---|
| Revenue | 1,125.7 | 1,359.3 | 1,325.4 | 1,276.8 | 1,195.3 | 1,219.9 | 1,244.9 | 1,270.4 | 1,296.5 | 1,323.1 |
| Revenue Growth, % | 0 | 20.75 | -2.5 | -3.67 | -6.38 | 2.05 | 2.05 | 2.05 | 2.05 | 2.05 |
| EBITDA | 149.5 | 182.5 | 156.8 | 144.1 | 82.4 | 138.4 | 141.2 | 144.1 | 147.1 | 150.1 |
| EBITDA, % | 13.28 | 13.42 | 11.83 | 11.29 | 6.89 | 11.34 | 11.34 | 11.34 | 11.34 | 11.34 |
| Depreciation | 77.3 | 81.2 | 77.0 | 72.2 | 69.4 | 73.5 | 75.0 | 76.5 | 78.1 | 79.7 |
| Depreciation, % | 6.87 | 5.97 | 5.81 | 5.66 | 5.8 | 6.02 | 6.02 | 6.02 | 6.02 | 6.02 |
| EBIT | 72.2 | 101.3 | 79.8 | 71.9 | 13.0 | 64.9 | 66.2 | 67.6 | 69.0 | 70.4 |
| EBIT, % | 6.42 | 7.45 | 6.02 | 5.63 | 1.09 | 5.32 | 5.32 | 5.32 | 5.32 | 5.32 |
| Total Cash | 30.0 | 7.9 | 4.9 | 6.6 | 20.8 | 14.3 | 14.6 | 14.9 | 15.2 | 15.5 |
| Total Cash, percent | .0 | .0 | .0 | .0 | .0 | .0 | .0 | .0 | .0 | .0 |
| Account Receivables | 41.2 | 32.7 | 52.0 | 41.1 | 35.2 | 39.4 | 40.2 | 41.1 | 41.9 | 42.8 |
| Account Receivables, % | 3.66 | 2.41 | 3.92 | 3.22 | 2.95 | 3.23 | 3.23 | 3.23 | 3.23 | 3.23 |
| Inventories | 162.3 | 166.3 | 147.4 | 154.1 | 181.5 | 158.6 | 161.9 | 165.2 | 168.6 | 172.1 |
| Inventories, % | 14.42 | 12.23 | 11.12 | 12.07 | 15.18 | 13 | 13 | 13 | 13 | 13 |
| Accounts Payable | 112.4 | 132.0 | 261.7 | 251.9 | 322.6 | 210.2 | 214.5 | 218.9 | 223.4 | 228.0 |
| Accounts Payable, % | 9.98 | 9.71 | 19.75 | 19.73 | 26.99 | 17.23 | 17.23 | 17.23 | 17.23 | 17.23 |
| Capital Expenditure | -51.7 | -27.8 | -39.0 | -25.5 | -26.4 | -33.6 | -34.3 | -35.0 | -35.7 | -36.5 |
| Capital Expenditure, % | -4.59 | -2.05 | -2.94 | -2 | -2.21 | -2.76 | -2.76 | -2.76 | -2.76 | -2.76 |
| Tax Rate, % | 12.36 | 12.36 | 12.36 | 12.36 | 12.36 | 12.36 | 12.36 | 12.36 | 12.36 | 12.36 |
| EBITAT | 56.1 | 80.7 | 54.5 | 52.1 | 11.4 | 50.1 | 51.1 | 52.1 | 53.2 | 54.3 |
| Depreciation | ||||||||||
| Changes in Account Receivables | ||||||||||
| Changes in Inventories | ||||||||||
| Changes in Accounts Payable | ||||||||||
| Capital Expenditure | ||||||||||
| UFCF | -9.5 | 158.2 | 221.9 | 93.2 | 103.6 | -3.9 | 92.0 | 93.9 | 95.8 | 97.8 |
| WACC, % | 5.83 | 5.86 | 5.65 | 5.73 | 6.01 | 5.82 | 5.82 | 5.82 | 5.82 | 5.82 |
| PV UFCF | ||||||||||
| SUM PV UFCF | 307.9 | |||||||||
| Long Term Growth Rate, % | 2.00 | |||||||||
| Free cash flow (T + 1) | 100 | |||||||||
| Terminal Value | 2,614 | |||||||||
| Present Terminal Value | 1,970 | |||||||||
| Enterprise Value | 2,278 | |||||||||
| Net Debt | 509 | |||||||||
| Equity Value | 1,769 | |||||||||
| Diluted Shares Outstanding, MM | 30 | |||||||||
| Equity Value Per Share | 59.10 |
What You Will Receive
- Comprehensive Financial Model: Monro, Inc.'s (MNRO) actual data facilitates accurate DCF valuation.
- Complete Forecast Flexibility: Modify revenue growth, profit margins, WACC, and other essential factors.
- Real-Time Calculations: Automatic updates ensure you receive immediate feedback as adjustments are made.
- Professional-Grade Template: A polished Excel file crafted for high-quality valuation presentations.
- Adaptable and Reusable: Designed for versatility, enabling ongoing use for in-depth forecasts.
Key Features
- Comprehensive DCF Tool: Features both unlevered and levered DCF valuation models tailored for Monro, Inc. (MNRO).
- WACC Estimator: Pre-configured Weighted Average Cost of Capital sheet with adjustable parameters.
- Customizable Forecast Inputs: Adjust growth projections, capital investments, and discount rates as needed.
- Integrated Financial Ratios: Evaluate profitability, leverage, and efficiency ratios specifically for Monro, Inc. (MNRO).
- Visual Dashboard and Charts: Graphical representations highlight essential valuation metrics for straightforward analysis.
How It Works
- Step 1: Download the Excel file.
- Step 2: Review pre-entered Monro, Inc. (MNRO) data (historical and projected).
- Step 3: Adjust key assumptions (yellow cells) based on your analysis.
- Step 4: View automatic recalculations for Monro, Inc.'s (MNRO) intrinsic value.
- Step 5: Use the outputs for investment decisions or reporting.
Why Choose Monro, Inc. (MNRO)?
- Proven Track Record: Established reputation in the automotive service industry ensures reliability.
- Comprehensive Services: Offers a wide range of services from tire sales to brake repairs, all in one place.
- Customer-Centric Approach: Focused on delivering exceptional customer service and satisfaction.
- Expert Technicians: Skilled professionals with extensive training ensure high-quality service.
- Commitment to Safety: Prioritizes safety in all services, giving peace of mind to customers.
Who Should Use This Product?
- Investors: Evaluate Monro, Inc.'s (MNRO) market position before making investment decisions.
- CFOs and Financial Analysts: Optimize valuation assessments and validate financial forecasts for Monro, Inc. (MNRO).
- Startup Founders: Understand the valuation methods applied to established companies like Monro, Inc. (MNRO).
- Consultants: Provide comprehensive valuation analyses and reports for clients interested in Monro, Inc. (MNRO).
- Students and Educators: Utilize Monro, Inc.'s (MNRO) data to enhance learning and practical application of valuation strategies.
What the Template Contains
- Pre-Filled Data: Includes Monro, Inc.'s historical financials and forecasts.
- Discounted Cash Flow Model: Editable DCF valuation model with automatic calculations.
- Weighted Average Cost of Capital (WACC): A dedicated sheet for calculating WACC based on custom inputs.
- Key Financial Ratios: Analyze Monro, Inc.'s profitability, efficiency, and leverage.
- Customizable Inputs: Edit revenue growth, margins, and tax rates with ease.
- Clear Dashboard: Charts and tables summarizing key valuation results.
Disclaimer
All information, articles, and product details provided on this website are for general informational and educational purposes only. We do not claim any ownership over, nor do we intend to infringe upon, any trademarks, copyrights, logos, brand names, or other intellectual property mentioned or depicted on this site. Such intellectual property remains the property of its respective owners, and any references here are made solely for identification or informational purposes, without implying any affiliation, endorsement, or partnership.
We make no representations or warranties, express or implied, regarding the accuracy, completeness, or suitability of any content or products presented. Nothing on this website should be construed as legal, tax, investment, financial, medical, or other professional advice. In addition, no part of this site—including articles or product references—constitutes a solicitation, recommendation, endorsement, advertisement, or offer to buy or sell any securities, franchises, or other financial instruments, particularly in jurisdictions where such activity would be unlawful.
All content is of a general nature and may not address the specific circumstances of any individual or entity. It is not a substitute for professional advice or services. Any actions you take based on the information provided here are strictly at your own risk. You accept full responsibility for any decisions or outcomes arising from your use of this website and agree to release us from any liability in connection with your use of, or reliance upon, the content or products found herein.