
|
DCF -Bewertung der Monster Beverage Corporation (MNST) |
Fully Editable: Tailor To Your Needs In Excel Or Sheets
Professional Design: Trusted, Industry-Standard Templates
Investor-Approved Valuation Models
MAC/PC Compatible, Fully Unlocked
No Expertise Is Needed; Easy To Follow
Monster Beverage Corporation (MNST) Bundle
Möchten Sie den inneren Wert der Monster Beverage Corporation bestimmen? Unser MNST-DCF-Taschenrechner integriert reale Daten mit umfangreichen Anpassungsoptionen, sodass Sie Prognosen anpassen und Ihre Anlagestrategien verbessern können.
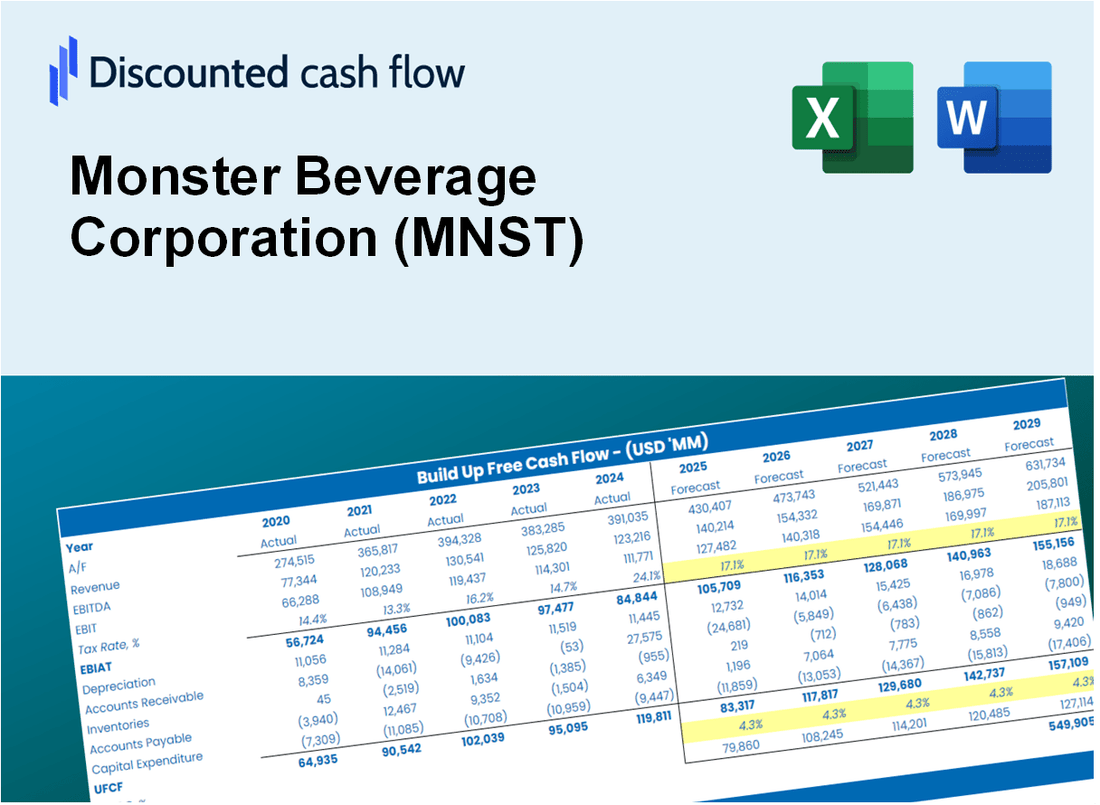
Discounted Cash Flow (DCF) - (USD MM)
| Year | AY1 2020 |
AY2 2021 |
AY3 2022 |
AY4 2023 |
AY5 2024 |
FY1 2025 |
FY2 2026 |
FY3 2027 |
FY4 2028 |
FY5 2029 |
|---|---|---|---|---|---|---|---|---|---|---|
| Revenue | 4,598.6 | 5,541.4 | 6,311.1 | 7,140.0 | 7,492.7 | 8,475.5 | 9,587.1 | 10,844.6 | 12,267.0 | 13,875.9 |
| Revenue Growth, % | 0 | 20.5 | 13.89 | 13.14 | 4.94 | 13.12 | 13.12 | 13.12 | 13.12 | 13.12 |
| EBITDA | 1,690.2 | 1,847.6 | 1,646.0 | 2,022.3 | 2,010.7 | 2,565.3 | 2,901.7 | 3,282.3 | 3,712.9 | 4,199.9 |
| EBITDA, % | 36.75 | 33.34 | 26.08 | 28.32 | 26.84 | 30.27 | 30.27 | 30.27 | 30.27 | 30.27 |
| Depreciation | 57.0 | 50.2 | 61.2 | 68.9 | 80.4 | 87.4 | 98.8 | 111.8 | 126.5 | 143.0 |
| Depreciation, % | 1.24 | 0.9051 | 0.97038 | 0.96495 | 1.07 | 1.03 | 1.03 | 1.03 | 1.03 | 1.03 |
| EBIT | 1,633.2 | 1,797.5 | 1,584.7 | 1,953.4 | 1,930.3 | 2,477.9 | 2,802.9 | 3,170.6 | 3,586.4 | 4,056.8 |
| EBIT, % | 35.51 | 32.44 | 25.11 | 27.36 | 25.76 | 29.24 | 29.24 | 29.24 | 29.24 | 29.24 |
| Total Cash | 2,061.8 | 3,076.2 | 2,669.5 | 3,253.3 | 1,533.3 | 3,537.2 | 4,001.2 | 4,526.0 | 5,119.6 | 5,791.1 |
| Total Cash, percent | .0 | .0 | .0 | .0 | .0 | .0 | .0 | .0 | .0 | .0 |
| Account Receivables | 666.0 | 896.7 | 1,016.2 | 1,194.0 | 1,221.6 | 1,352.6 | 1,530.0 | 1,730.6 | 1,957.6 | 2,214.4 |
| Account Receivables, % | 14.48 | 16.18 | 16.1 | 16.72 | 16.3 | 15.96 | 15.96 | 15.96 | 15.96 | 15.96 |
| Inventories | 333.1 | 593.4 | 935.6 | 971.4 | 737.1 | 953.0 | 1,078.0 | 1,219.3 | 1,379.3 | 1,560.2 |
| Inventories, % | 7.24 | 10.71 | 14.83 | 13.61 | 9.84 | 11.24 | 11.24 | 11.24 | 11.24 | 11.24 |
| Accounts Payable | 296.8 | 404.3 | 444.3 | 564.4 | 466.8 | 592.0 | 669.6 | 757.5 | 856.8 | 969.2 |
| Accounts Payable, % | 6.45 | 7.3 | 7.04 | 7.9 | 6.23 | 6.98 | 6.98 | 6.98 | 6.98 | 6.98 |
| Capital Expenditure | -67.3 | -57.5 | -212.2 | -234.7 | -306.4 | -224.4 | -253.8 | -287.1 | -324.8 | -367.4 |
| Capital Expenditure, % | -1.46 | -1.04 | -3.36 | -3.29 | -4.09 | -2.65 | -2.65 | -2.65 | -2.65 | -2.65 |
| Tax Rate, % | 24.15 | 24.15 | 24.15 | 24.15 | 24.15 | 24.15 | 24.15 | 24.15 | 24.15 | 24.15 |
| EBITAT | 1,415.7 | 1,374.5 | 1,201.3 | 1,540.2 | 1,464.2 | 1,950.9 | 2,206.8 | 2,496.2 | 2,823.6 | 3,194.0 |
| Depreciation | ||||||||||
| Changes in Account Receivables | ||||||||||
| Changes in Inventories | ||||||||||
| Changes in Accounts Payable | ||||||||||
| Capital Expenditure | ||||||||||
| UFCF | 703.1 | 983.7 | 628.6 | 1,281.0 | 1,347.2 | 1,592.3 | 1,827.0 | 2,066.6 | 2,337.7 | 2,644.3 |
| WACC, % | 6.26 | 6.26 | 6.26 | 6.26 | 6.26 | 6.26 | 6.26 | 6.26 | 6.26 | 6.26 |
| PV UFCF | ||||||||||
| SUM PV UFCF | 8,624.2 | |||||||||
| Long Term Growth Rate, % | 4.00 | |||||||||
| Free cash flow (T + 1) | 2,750 | |||||||||
| Terminal Value | 121,611 | |||||||||
| Present Terminal Value | 89,763 | |||||||||
| Enterprise Value | 98,387 | |||||||||
| Net Debt | -1,159 | |||||||||
| Equity Value | 99,546 | |||||||||
| Diluted Shares Outstanding, MM | 1,013 | |||||||||
| Equity Value Per Share | 98.26 |
What You Will Receive
- Authentic Monster Data: Preloaded financials – encompassing revenue to EBIT – derived from actual and projected figures.
- Complete Customization: Modify all essential parameters (yellow cells) such as WACC, growth %, and tax rates.
- Immediate Valuation Updates: Automatic recalculations to evaluate the effects of changes on Monster Beverage's fair value.
- Flexible Excel Template: Designed for quick modifications, scenario analysis, and comprehensive projections.
- Efficient and Precise: Avoid the hassle of building models from the ground up while ensuring accuracy and adaptability.
Key Features
- Real-Life MNST Data: Pre-filled with Monster Beverage’s historical financials and forward-looking projections.
- Fully Customizable Inputs: Adjust revenue growth, margins, WACC, tax rates, and capital expenditures.
- Dynamic Valuation Model: Automatic updates to Net Present Value (NPV) and intrinsic value based on your inputs.
- Scenario Testing: Create multiple forecast scenarios to analyze different valuation outcomes.
- User-Friendly Design: Simple, structured, and designed for professionals and beginners alike.
How It Works
- Step 1: Download the Excel file.
- Step 2: Review pre-entered Monster Beverage data (historical and projected).
- Step 3: Adjust key assumptions (yellow cells) based on your analysis.
- Step 4: View automatic recalculations for Monster Beverage’s intrinsic value.
- Step 5: Use the outputs for investment decisions or reporting.
Why Choose This Calculator for Monster Beverage Corporation (MNST)?
- Designed for Experts: A sophisticated tool utilized by financial analysts, CFOs, and industry consultants.
- Accurate Data: Monster Beverage's historical and forecasted financials are preloaded for precision.
- Flexible Scenario Analysis: Effortlessly test various forecasts and assumptions.
- Comprehensive Outputs: Instantly calculates intrinsic value, NPV, and essential financial metrics.
- User-Friendly: Step-by-step guidance ensures a smooth calculation process.
Who Should Use Monster Beverage Corporation (MNST)?
- Investors: Gain insights into the beverage market with a leading brand's performance metrics.
- Market Analysts: Utilize comprehensive data to assess growth potential and market trends.
- Brand Consultants: Leverage brand strategies and case studies for client projects.
- Health and Fitness Advocates: Explore product offerings that cater to active lifestyles and energy needs.
- Students and Researchers: Use it as a case study in business courses focusing on branding and marketing.
What the Template Contains
- Comprehensive DCF Model: Editable template featuring detailed valuation calculations.
- Real-World Data: Monster Beverage Corporation’s (MNST) historical and projected financials preloaded for analysis.
- Customizable Parameters: Modify WACC, growth rates, and tax assumptions to explore various scenarios.
- Financial Statements: Complete annual and quarterly breakdowns for enhanced insights.
- Key Ratios: Integrated analysis for profitability, efficiency, and leverage metrics.
- Dashboard with Visual Outputs: Charts and tables providing clear, actionable results.
Disclaimer
All information, articles, and product details provided on this website are for general informational and educational purposes only. We do not claim any ownership over, nor do we intend to infringe upon, any trademarks, copyrights, logos, brand names, or other intellectual property mentioned or depicted on this site. Such intellectual property remains the property of its respective owners, and any references here are made solely for identification or informational purposes, without implying any affiliation, endorsement, or partnership.
We make no representations or warranties, express or implied, regarding the accuracy, completeness, or suitability of any content or products presented. Nothing on this website should be construed as legal, tax, investment, financial, medical, or other professional advice. In addition, no part of this site—including articles or product references—constitutes a solicitation, recommendation, endorsement, advertisement, or offer to buy or sell any securities, franchises, or other financial instruments, particularly in jurisdictions where such activity would be unlawful.
All content is of a general nature and may not address the specific circumstances of any individual or entity. It is not a substitute for professional advice or services. Any actions you take based on the information provided here are strictly at your own risk. You accept full responsibility for any decisions or outcomes arising from your use of this website and agree to release us from any liability in connection with your use of, or reliance upon, the content or products found herein.