
|
Mobiquity Technologies, Inc. (MOBQ) DCF -Bewertung |
Fully Editable: Tailor To Your Needs In Excel Or Sheets
Professional Design: Trusted, Industry-Standard Templates
Investor-Approved Valuation Models
MAC/PC Compatible, Fully Unlocked
No Expertise Is Needed; Easy To Follow
Mobiquity Technologies, Inc. (MOBQ) Bundle
Vereinfachen Sie die Bewertung von Mobiquity Technologies, Inc. (MOBQ) mit diesem anpassbaren DCF -Taschenrechner! Mit Real Mobiquity Technologies, Inc. (MOBQ) Finanzdaten und einstellbaren Prognoseeingaben können Sie Szenarien testen und Mobiquity Technologies, Inc. (MOBQ) in Minuten aufdecken.
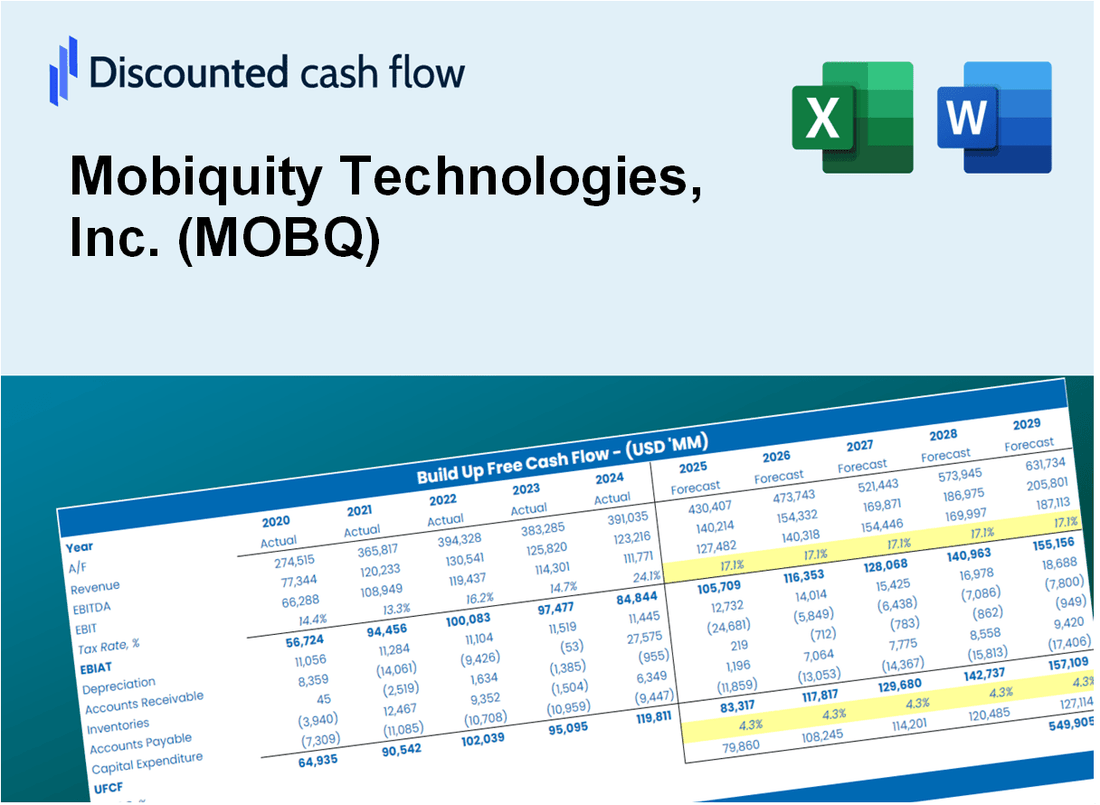
Discounted Cash Flow (DCF) - (USD MM)
| Year | AY1 2020 |
AY2 2021 |
AY3 2022 |
AY4 2023 |
AY5 2024 |
FY1 2025 |
FY2 2026 |
FY3 2027 |
FY4 2028 |
FY5 2029 |
|---|---|---|---|---|---|---|---|---|---|---|
| Revenue | 6.2 | 2.7 | 4.2 | .9 | 2.1 | 2.2 | 2.3 | 2.4 | 2.5 | 2.7 |
| Revenue Growth, % | 0 | -56.78 | 55.92 | -79.36 | 142.47 | 4.95 | 4.95 | 4.95 | 4.95 | 4.95 |
| EBITDA | -5.2 | -16.0 | -7.3 | -5.3 | -8.2 | -2.1 | -2.2 | -2.3 | -2.5 | -2.6 |
| EBITDA, % | -84.42 | -598.25 | -176.18 | -611.33 | -393.73 | -96.88 | -96.88 | -96.88 | -96.88 | -96.88 |
| Depreciation | 1.8 | .8 | .6 | .7 | .0 | .7 | .7 | .7 | .8 | .8 |
| Depreciation, % | 29.22 | 30.24 | 14.64 | 79.67 | -0.58131 | 30.64 | 30.64 | 30.64 | 30.64 | 30.64 |
| EBIT | -7.0 | -16.8 | -8.0 | -5.9 | -8.2 | -2.2 | -2.3 | -2.4 | -2.5 | -2.7 |
| EBIT, % | -113.64 | -628.5 | -190.81 | -691 | -393.15 | -100 | -100 | -100 | -100 | -100 |
| Total Cash | .6 | 5.4 | .2 | .5 | 1.2 | 1.0 | 1.1 | 1.1 | 1.2 | 1.2 |
| Total Cash, percent | .0 | .0 | .0 | .0 | .0 | .0 | .0 | .0 | .0 | .0 |
| Account Receivables | 1.7 | .4 | .3 | .0 | .0 | .2 | .3 | .3 | .3 | .3 |
| Account Receivables, % | 27.47 | 14.52 | 8.18 | 4.03 | 2.3 | 11.3 | 11.3 | 11.3 | 11.3 | 11.3 |
| Inventories | -46,396.0 | .0 | .0 | .0 | .0 | -.4 | -.5 | -.5 | -.5 | -.5 |
| Inventories, % | -750256.77 | 0 | 0 | 0 | 0 | -20 | -20 | -20 | -20 | -20 |
| Accounts Payable | 3.1 | 2.4 | 2.1 | 1.6 | 2.5 | 1.7 | 1.8 | 1.9 | 2.0 | 2.1 |
| Accounts Payable, % | 50.78 | 88.59 | 49.61 | 189.16 | 121.24 | 77.8 | 77.8 | 77.8 | 77.8 | 77.8 |
| Capital Expenditure | .0 | .0 | .0 | -2.2 | -1.4 | -.7 | -.8 | -.8 | -.9 | -.9 |
| Capital Expenditure, % | -0.10671 | -0.24216 | -0.19207 | -250.9 | -69.26 | -33.96 | -33.96 | -33.96 | -33.96 | -33.96 |
| Tax Rate, % | 0.97175 | 0.97175 | 0.97175 | 0.97175 | 0.97175 | 0.97175 | 0.97175 | 0.97175 | 0.97175 | 0.97175 |
| EBITAT | -7.4 | -17.2 | -8.5 | -5.8 | -8.1 | -2.2 | -2.3 | -2.4 | -2.5 | -2.6 |
| Depreciation | ||||||||||
| Changes in Account Receivables | ||||||||||
| Changes in Inventories | ||||||||||
| Changes in Accounts Payable | ||||||||||
| Capital Expenditure | ||||||||||
| UFCF | 46,391.8 | -46,411.8 | -8.2 | -7.4 | -8.7 | -2.8 | -2.3 | -2.4 | -2.5 | -2.6 |
| WACC, % | 13.39 | 13.39 | 13.39 | 13.31 | 13.36 | 13.37 | 13.37 | 13.37 | 13.37 | 13.37 |
| PV UFCF | ||||||||||
| SUM PV UFCF | -8.8 | |||||||||
| Long Term Growth Rate, % | 2.00 | |||||||||
| Free cash flow (T + 1) | -3 | |||||||||
| Terminal Value | -23 | |||||||||
| Present Terminal Value | -13 | |||||||||
| Enterprise Value | -21 | |||||||||
| Net Debt | 0 | |||||||||
| Equity Value | -21 | |||||||||
| Diluted Shares Outstanding, MM | 13 | |||||||||
| Equity Value Per Share | -1.63 |
What You Will Get
- Real Mobiquity Data: Preloaded financials – from revenue to EBIT – based on actual and projected figures for Mobiquity Technologies, Inc. (MOBQ).
- Full Customization: Adjust all critical parameters (yellow cells) like WACC, growth %, and tax rates to fit your analysis.
- Instant Valuation Updates: Automatic recalculations to assess the impact of changes on Mobiquity’s fair value.
- Versatile Excel Template: Designed for quick edits, scenario testing, and comprehensive projections specific to Mobiquity Technologies, Inc. (MOBQ).
- Time-Saving and Accurate: Avoid building models from scratch while ensuring precision and flexibility in your financial assessments.
Key Features
- Real-Time MOBQ Data: Pre-loaded with Mobiquity Technologies' historical performance metrics and future growth estimates.
- Customizable Parameters: Modify assumptions related to revenue growth, profit margins, discount rates, tax implications, and capital investments.
- Interactive Valuation Model: Instantaneous updates to Net Present Value (NPV) and intrinsic value reflecting your adjustments.
- Scenario Analysis: Develop various forecasting models to evaluate different valuation scenarios.
- Intuitive Interface: Clean, organized, and crafted for both seasoned professionals and newcomers.
How It Works
- Step 1: Download the prebuilt Excel template featuring Mobiquity Technologies, Inc. (MOBQ) data.
- Step 2: Review the pre-filled sheets to familiarize yourself with the essential metrics.
- Step 3: Modify forecasts and assumptions in the editable yellow cells (WACC, growth, margins).
- Step 4: Immediately view updated results, including Mobiquity Technologies, Inc. (MOBQ) intrinsic value.
- Step 5: Make well-informed investment choices or create reports based on the outputs.
Why Choose This Calculator?
- Accurate Data: Real Mobiquity Technologies financials ensure reliable valuation results.
- Customizable: Adjust key parameters like growth rates, WACC, and tax rates to align with your projections.
- Time-Saving: Pre-built calculations save you the effort of starting from scratch.
- Professional-Grade Tool: Tailored for investors, analysts, and consultants focused on (MOBQ).
- User-Friendly: Intuitive design and step-by-step guidance make it accessible for all users.
Who Should Use This Product?
- Professional Investors: Develop comprehensive and trustworthy valuation models for analyzing portfolios involving Mobiquity Technologies, Inc. (MOBQ).
- Corporate Finance Teams: Evaluate valuation scenarios to inform strategic decisions within their organizations.
- Consultants and Advisors: Deliver precise valuation insights to clients interested in investing in Mobiquity Technologies, Inc. (MOBQ).
- Students and Educators: Utilize real-world data for practicing and teaching financial modeling techniques relevant to the tech sector.
- Tech Enthusiasts: Gain insights into how companies like Mobiquity Technologies, Inc. (MOBQ) are valued in the competitive market.
What the Template Contains
- Preloaded MOBQ Data: Historical and projected financial data, including revenue, EBIT, and capital expenditures.
- DCF and WACC Models: Professional-grade sheets for calculating intrinsic value and Weighted Average Cost of Capital.
- Editable Inputs: Yellow-highlighted cells for adjusting revenue growth, tax rates, and discount rates.
- Financial Statements: Comprehensive annual and quarterly financials for deeper analysis.
- Key Ratios: Profitability, leverage, and efficiency ratios to evaluate performance.
- Dashboard and Charts: Visual summaries of valuation outcomes and assumptions.
Disclaimer
All information, articles, and product details provided on this website are for general informational and educational purposes only. We do not claim any ownership over, nor do we intend to infringe upon, any trademarks, copyrights, logos, brand names, or other intellectual property mentioned or depicted on this site. Such intellectual property remains the property of its respective owners, and any references here are made solely for identification or informational purposes, without implying any affiliation, endorsement, or partnership.
We make no representations or warranties, express or implied, regarding the accuracy, completeness, or suitability of any content or products presented. Nothing on this website should be construed as legal, tax, investment, financial, medical, or other professional advice. In addition, no part of this site—including articles or product references—constitutes a solicitation, recommendation, endorsement, advertisement, or offer to buy or sell any securities, franchises, or other financial instruments, particularly in jurisdictions where such activity would be unlawful.
All content is of a general nature and may not address the specific circumstances of any individual or entity. It is not a substitute for professional advice or services. Any actions you take based on the information provided here are strictly at your own risk. You accept full responsibility for any decisions or outcomes arising from your use of this website and agree to release us from any liability in connection with your use of, or reliance upon, the content or products found herein.