
|
Nathans Famous, Inc. (Nath) DCF -Bewertung |
Fully Editable: Tailor To Your Needs In Excel Or Sheets
Professional Design: Trusted, Industry-Standard Templates
Investor-Approved Valuation Models
MAC/PC Compatible, Fully Unlocked
No Expertise Is Needed; Easy To Follow
Nathan's Famous, Inc. (NATH) Bundle
Stürzen Sie Ihre Analyse und verbessern Sie die Präzision mit unserem [Symbol] DCF -Taschenrechner! Mit realen Daten aus Nathans Famous, Inc. und anpassbaren Annahmen befindet sich dieses Tool Sie, um [Unternehmen] wie ein erfahrener Investor zu prognostizieren, zu analysieren und zu schätzen.
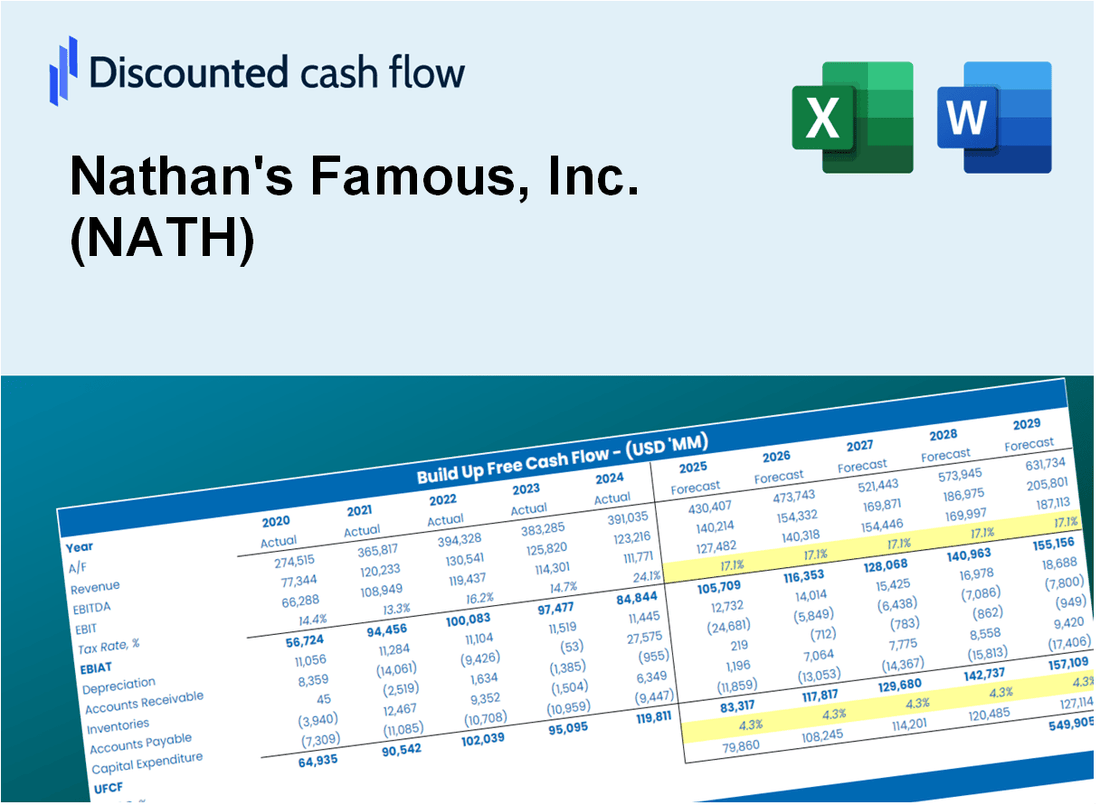
Discounted Cash Flow (DCF) - (USD MM)
| Year | AY1 2020 |
AY2 2021 |
AY3 2022 |
AY4 2023 |
AY5 2024 |
FY1 2025 |
FY2 2026 |
FY3 2027 |
FY4 2028 |
FY5 2029 |
|---|---|---|---|---|---|---|---|---|---|---|
| Revenue | 75.8 | 114.9 | 130.8 | 138.6 | 148.2 | 177.2 | 211.8 | 253.2 | 302.7 | 361.9 |
| Revenue Growth, % | 0 | 51.48 | 13.84 | 5.98 | 6.91 | 19.55 | 19.55 | 19.55 | 19.55 | 19.55 |
| EBITDA | 27.1 | 29.7 | 35.7 | 33.9 | 37.8 | 49.2 | 58.8 | 70.3 | 84.1 | 100.5 |
| EBITDA, % | 35.75 | 25.87 | 27.28 | 24.49 | 25.53 | 27.78 | 27.78 | 27.78 | 27.78 | 27.78 |
| Depreciation | 1.2 | 1.1 | 1.1 | 1.1 | 1.0 | 1.7 | 2.0 | 2.4 | 2.9 | 3.5 |
| Depreciation, % | 1.56 | 0.91746 | 0.86784 | 0.81884 | 0.64583 | 0.96197 | 0.96197 | 0.96197 | 0.96197 | 0.96197 |
| EBIT | 25.9 | 28.7 | 34.5 | 32.8 | 36.9 | 47.5 | 56.8 | 67.9 | 81.2 | 97.1 |
| EBIT, % | 34.19 | 24.96 | 26.41 | 23.67 | 24.88 | 26.82 | 26.82 | 26.82 | 26.82 | 26.82 |
| Total Cash | 81.1 | 50.1 | 29.9 | 21.0 | 27.8 | 71.0 | 84.9 | 101.5 | 121.3 | 145.0 |
| Total Cash, percent | .0 | .0 | .0 | .0 | .0 | .0 | .0 | .0 | .0 | .0 |
| Account Receivables | 12.0 | 13.4 | 15.3 | 15.7 | 14.6 | 21.4 | 25.6 | 30.6 | 36.6 | 43.7 |
| Account Receivables, % | 15.85 | 11.7 | 11.69 | 11.31 | 9.88 | 12.09 | 12.09 | 12.09 | 12.09 | 12.09 |
| Inventories | .6 | .5 | .5 | .8 | 1.2 | 1.1 | 1.3 | 1.6 | 1.9 | 2.3 |
| Inventories, % | 0.8228 | 0.45438 | 0.41213 | 0.60746 | 0.82399 | 0.62415 | 0.62415 | 0.62415 | 0.62415 | 0.62415 |
| Accounts Payable | 4.0 | 6.4 | 6.5 | 5.7 | 6.2 | 8.5 | 10.2 | 12.2 | 14.6 | 17.5 |
| Accounts Payable, % | 5.33 | 5.55 | 4.94 | 4.14 | 4.16 | 4.83 | 4.83 | 4.83 | 4.83 | 4.83 |
| Capital Expenditure | -.6 | -.6 | -.6 | -.3 | -.2 | -.8 | -.9 | -1.1 | -1.3 | -1.5 |
| Capital Expenditure, % | -0.72654 | -0.55361 | -0.47865 | -0.22581 | -0.15184 | -0.42729 | -0.42729 | -0.42729 | -0.42729 | -0.42729 |
| Tax Rate, % | 26.66 | 26.66 | 26.66 | 26.66 | 26.66 | 26.66 | 26.66 | 26.66 | 26.66 | 26.66 |
| EBITAT | 18.7 | 21.0 | 25.3 | 23.4 | 27.0 | 34.6 | 41.3 | 49.4 | 59.0 | 70.6 |
| Depreciation | ||||||||||
| Changes in Account Receivables | ||||||||||
| Changes in Inventories | ||||||||||
| Changes in Accounts Payable | ||||||||||
| Capital Expenditure | ||||||||||
| UFCF | 10.8 | 22.5 | 24.0 | 22.9 | 28.9 | 31.2 | 39.7 | 47.5 | 56.8 | 67.9 |
| WACC, % | 5.22 | 5.23 | 5.22 | 5.21 | 5.23 | 5.22 | 5.22 | 5.22 | 5.22 | 5.22 |
| PV UFCF | ||||||||||
| SUM PV UFCF | 205.2 | |||||||||
| Long Term Growth Rate, % | 0.50 | |||||||||
| Free cash flow (T + 1) | 68 | |||||||||
| Terminal Value | 1,445 | |||||||||
| Present Terminal Value | 1,120 | |||||||||
| Enterprise Value | 1,326 | |||||||||
| Net Debt | 28 | |||||||||
| Equity Value | 1,297 | |||||||||
| Diluted Shares Outstanding, MM | 4 | |||||||||
| Equity Value Per Share | 316.84 |
What You Will Get
- Editable Excel Template: A fully customizable Excel-based DCF Calculator featuring pre-filled real Nathan's Famous, Inc. (NATH) financials.
- Real-World Data: Historical data and forward-looking estimates (highlighted in the yellow cells).
- Forecast Flexibility: Adjust forecast assumptions such as revenue growth, EBITDA %, and WACC.
- Automatic Calculations: Instantly observe the effects of your inputs on Nathan's valuation.
- Professional Tool: Designed for investors, CFOs, consultants, and financial analysts.
- User-Friendly Design: Organized for clarity and ease of use, complete with step-by-step instructions.
Key Features
- Customizable Financial Metrics: Adjust essential inputs such as sales growth, operating margin, and capital investments.
- Instant DCF Valuation: Quickly determines intrinsic value, NPV, and other financial outputs.
- High-Precision Accuracy: Leverages Nathan's real-world financial data for dependable valuation results.
- Streamlined Scenario Analysis: Easily explore various assumptions and assess their impacts on outcomes.
- Efficiency Booster: Avoid the hassle of constructing intricate valuation models from the ground up.
How It Works
- 1. Access the Template: Download and open the Excel file featuring Nathan's Famous, Inc.'s preloaded data.
- 2. Modify Assumptions: Adjust key inputs such as growth projections, WACC, and capital expenditures.
- 3. Analyze Results Instantly: The DCF model automatically computes intrinsic value and NPV.
- 4. Explore Scenarios: Evaluate various forecasts to assess different valuation scenarios.
- 5. Present with Assurance: Deliver expert valuation insights to back your strategic decisions.
Why Choose This Calculator for Nathan's Famous, Inc. (NATH)?
- Comprehensive Tool: Features DCF, WACC, and financial ratio analyses tailored for Nathan's Famous, Inc. (NATH).
- Customizable Inputs: Modify yellow-highlighted cells to explore different financial scenarios for Nathan's Famous, Inc. (NATH).
- Detailed Insights: Automatically calculates the intrinsic value and Net Present Value specific to Nathan's Famous, Inc. (NATH).
- Preloaded Data: Historical and projected data provide reliable starting points for analysis of Nathan's Famous, Inc. (NATH).
- Professional Quality: Perfect for financial analysts, investors, and business consultants focusing on Nathan's Famous, Inc. (NATH).
Who Should Use This Product?
- Professional Investors: Develop comprehensive and accurate valuation models for assessing Nathan's Famous, Inc. (NATH) investments.
- Corporate Finance Teams: Evaluate valuation scenarios to inform strategic decisions within the company.
- Consultants and Advisors: Deliver precise valuation insights to clients interested in Nathan's Famous, Inc. (NATH) stock.
- Students and Educators: Utilize real-world data to enhance learning and practice in financial modeling.
- Food Industry Analysts: Gain insights into how companies like Nathan's Famous, Inc. (NATH) are valued in the marketplace.
What the Template Contains
- Preloaded NATH Data: Historical and projected financial data, including revenue, EBIT, and capital expenditures.
- DCF and WACC Models: Professional-grade sheets for calculating intrinsic value and Weighted Average Cost of Capital.
- Editable Inputs: Yellow-highlighted cells for adjusting revenue growth, tax rates, and discount rates.
- Financial Statements: Comprehensive annual and quarterly financials for deeper analysis.
- Key Ratios: Profitability, leverage, and efficiency ratios to evaluate performance.
- Dashboard and Charts: Visual summaries of valuation outcomes and assumptions.
Disclaimer
All information, articles, and product details provided on this website are for general informational and educational purposes only. We do not claim any ownership over, nor do we intend to infringe upon, any trademarks, copyrights, logos, brand names, or other intellectual property mentioned or depicted on this site. Such intellectual property remains the property of its respective owners, and any references here are made solely for identification or informational purposes, without implying any affiliation, endorsement, or partnership.
We make no representations or warranties, express or implied, regarding the accuracy, completeness, or suitability of any content or products presented. Nothing on this website should be construed as legal, tax, investment, financial, medical, or other professional advice. In addition, no part of this site—including articles or product references—constitutes a solicitation, recommendation, endorsement, advertisement, or offer to buy or sell any securities, franchises, or other financial instruments, particularly in jurisdictions where such activity would be unlawful.
All content is of a general nature and may not address the specific circumstances of any individual or entity. It is not a substitute for professional advice or services. Any actions you take based on the information provided here are strictly at your own risk. You accept full responsibility for any decisions or outcomes arising from your use of this website and agree to release us from any liability in connection with your use of, or reliance upon, the content or products found herein.