
|
Info Edge Limited (Naukri.ns) DCF -Bewertung |
Fully Editable: Tailor To Your Needs In Excel Or Sheets
Professional Design: Trusted, Industry-Standard Templates
Investor-Approved Valuation Models
MAC/PC Compatible, Fully Unlocked
No Expertise Is Needed; Easy To Follow
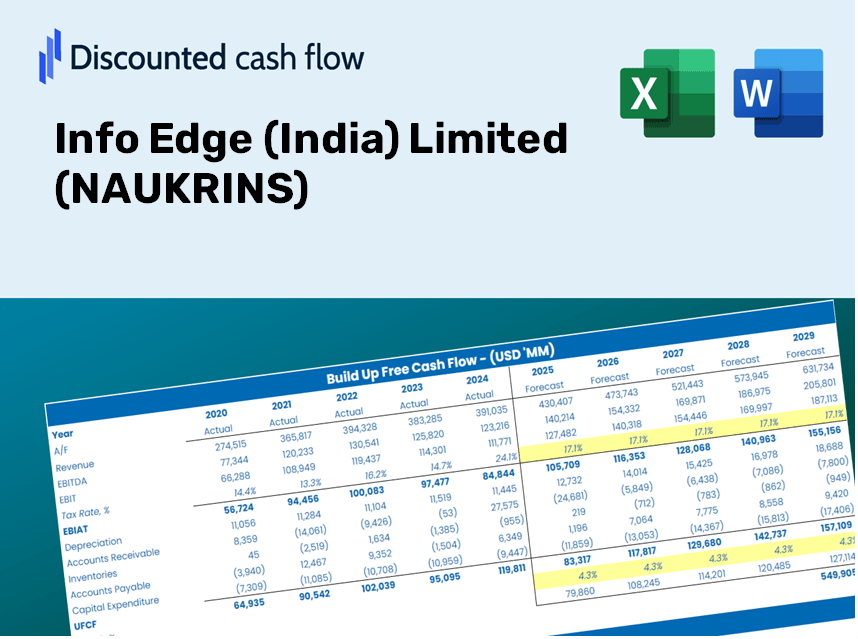
Info Edge (India) Limited (NAUKRI.NS) Bundle
Bewerten Sie die finanziellen Aussichten von Info Edge (India) Limited (Naukrins) mit fachkundiger Präzision! Dieser (Naukrins) DCF-Taschenrechner verfügt über vorgefüllte Finanzdaten und bietet totale Flexibilität, um das Umsatzwachstum, WACC, Margen und andere wesentliche Annahmen zu ändern, um sich mit Ihren Vorhersagen auszurichten.
Benefits You Will Receive
- Adjustable Forecast Variables: Effortlessly modify key assumptions (growth %, margins, WACC) to explore various scenarios.
- Real-Time Data: Info Edge (India) Limited's financial metrics pre-filled to facilitate your analysis.
- Automated DCF Calculations: The template computes Net Present Value (NPV) and intrinsic value automatically for you.
- Tailored and Professional: A refined Excel model that can adapt to your specific valuation requirements.
- Designed for Analysts and Investors: Perfect for evaluating projections, confirming strategies, and enhancing efficiency.
Key Features
- Customizable Forecast Inputs: Adjust essential parameters such as revenue growth, EBITDA margins, and capital expenditures.
- Instant DCF Valuation: Quickly computes intrinsic value, NPV, and various financial metrics.
- High Precision Results: Leverages Info Edge (India) Limited’s real financial data for credible valuation results.
- Effortless Scenario Analysis: Easily explore different assumptions and evaluate their impacts.
- Efficiency Booster: Streamlines the valuation process, removing the need for intricate model building from the ground up.
How It Works
- Step 1: Download the Excel spreadsheet.
- Step 2: Examine the pre-filled data for Info Edge (India) Limited (NAUKRINS) including historical and projected figures.
- Step 3: Modify key assumptions (highlighted in yellow) according to your insights.
- Step 4: Observe the automatic recalculations of Info Edge’s intrinsic value.
- Step 5: Utilize the results for making informed investment choices or for reporting purposes.
Why Opt for NAUKRINS Calculator?
- Time-Saving: Skip the hassle of building a DCF model from the ground up – it’s ready for immediate use.
- Enhanced Accuracy: Dependable financial data and formulas minimize valuation errors.
- Completely Customizable: Adjust the model to fit your unique assumptions and projections.
- Simple to Understand: Intuitive charts and outputs ensure results are easily interpretable.
- Endorsed by Professionals: Crafted for experts who prioritize accuracy and ease of use.
Who Can Benefit from This Product?
- Professional Investors: Create comprehensive and dependable valuation models for portfolio evaluation.
- Corporate Finance Teams: Assess valuation scenarios to steer internal decision-making.
- Consultants and Advisors: Equip clients with precise valuation insights for Info Edge (NAUKRINS) stock.
- Students and Educators: Utilize real-world data to enhance financial modeling skills and education.
- Tech Enthusiasts: Gain insights into how companies like Info Edge (NAUKRINS) are appraised in the market.
What the Template Contains
- Historical Data: Encompasses Info Edge (India) Limited's past financial performance and foundational forecasts.
- DCF and Levered DCF Models: Comprehensive templates designed to determine the intrinsic value of Info Edge (India) Limited.
- WACC Sheet: Ready-to-use calculations for the Weighted Average Cost of Capital.
- Editable Inputs: Adjust critical parameters such as growth rates, EBITDA %, and CAPEX assumptions.
- Quarterly and Annual Statements: Detailed breakdown of Info Edge (India) Limited's financial results.
- Interactive Dashboard: Visualize valuation outcomes and projections in an engaging manner.
Disclaimer
All information, articles, and product details provided on this website are for general informational and educational purposes only. We do not claim any ownership over, nor do we intend to infringe upon, any trademarks, copyrights, logos, brand names, or other intellectual property mentioned or depicted on this site. Such intellectual property remains the property of its respective owners, and any references here are made solely for identification or informational purposes, without implying any affiliation, endorsement, or partnership.
We make no representations or warranties, express or implied, regarding the accuracy, completeness, or suitability of any content or products presented. Nothing on this website should be construed as legal, tax, investment, financial, medical, or other professional advice. In addition, no part of this site—including articles or product references—constitutes a solicitation, recommendation, endorsement, advertisement, or offer to buy or sell any securities, franchises, or other financial instruments, particularly in jurisdictions where such activity would be unlawful.
All content is of a general nature and may not address the specific circumstances of any individual or entity. It is not a substitute for professional advice or services. Any actions you take based on the information provided here are strictly at your own risk. You accept full responsibility for any decisions or outcomes arising from your use of this website and agree to release us from any liability in connection with your use of, or reliance upon, the content or products found herein.