
|
Nudeln & Firma (NDLS) DCF -Bewertung |
Fully Editable: Tailor To Your Needs In Excel Or Sheets
Professional Design: Trusted, Industry-Standard Templates
Investor-Approved Valuation Models
MAC/PC Compatible, Fully Unlocked
No Expertise Is Needed; Easy To Follow
Noodles & Company (NDLS) Bundle
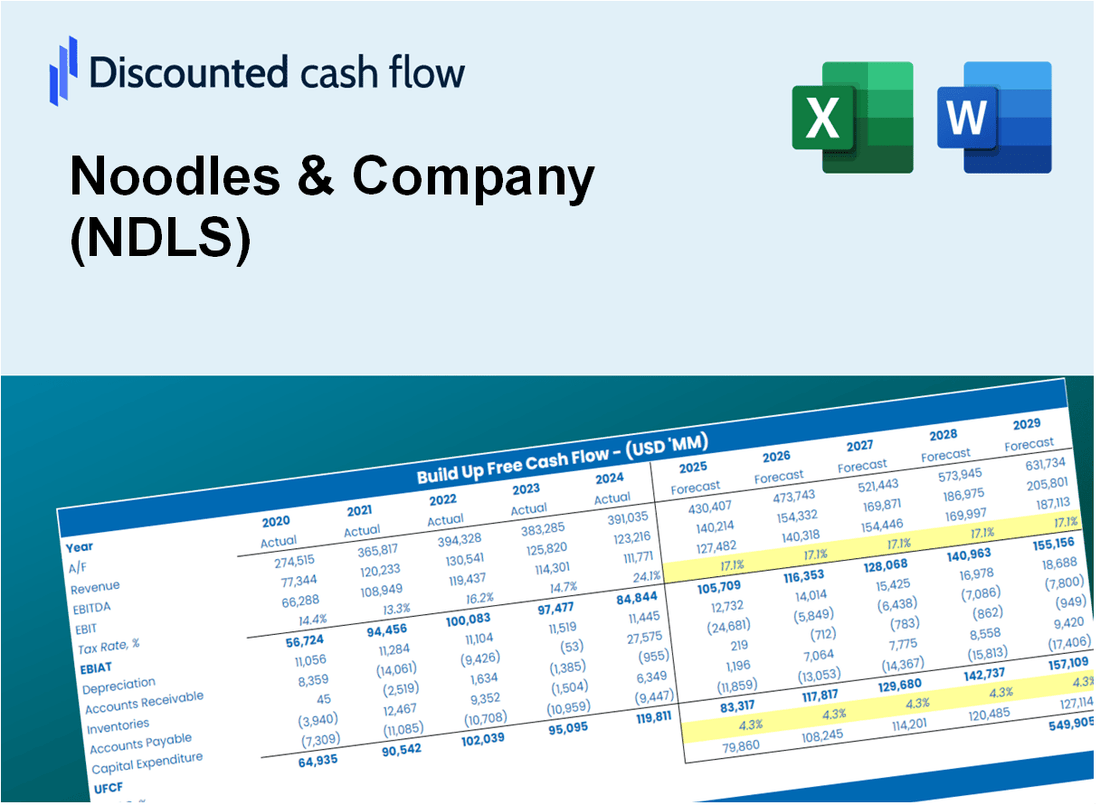
Egal, ob Sie ein Investor oder Analyst sind, diese Nudeln & Der DCF -Taschenrechner des Unternehmens (NDLS) ist das perfekte Werkzeug für eine genaue Bewertung. Mit echten Daten von Nudeln & Unternehmen können problemlos Prognosen anpassen und die Auswirkungen sofort beobachten.
Discounted Cash Flow (DCF) - (USD MM)
| Year | AY1 2020 |
AY2 2021 |
AY3 2022 |
AY4 2023 |
AY5 2024 |
FY1 2025 |
FY2 2026 |
FY3 2027 |
FY4 2028 |
FY5 2029 |
|---|---|---|---|---|---|---|---|---|---|---|
| Revenue | 393.7 | 475.2 | 509.5 | 503.4 | 493.3 | 523.8 | 556.1 | 590.5 | 627.0 | 665.7 |
| Revenue Growth, % | 0 | 20.7 | 7.22 | -1.19 | -2.01 | 6.18 | 6.18 | 6.18 | 6.18 | 6.18 |
| EBITDA | 1.7 | 28.2 | 22.4 | 21.8 | 1.3 | 16.1 | 17.1 | 18.1 | 19.2 | 20.4 |
| EBITDA, % | 0.42677 | 5.92 | 4.4 | 4.32 | 0.26111 | 3.07 | 3.07 | 3.07 | 3.07 | 3.07 |
| Depreciation | 21.7 | 22.3 | 23.3 | 26.8 | 29.1 | 27.2 | 28.9 | 30.7 | 32.6 | 34.6 |
| Depreciation, % | 5.51 | 4.7 | 4.57 | 5.32 | 5.89 | 5.2 | 5.2 | 5.2 | 5.2 | 5.2 |
| EBIT | -20.0 | 5.8 | -.8 | -5.0 | -27.8 | -11.2 | -11.9 | -12.6 | -13.4 | -14.2 |
| EBIT, % | -5.09 | 1.22 | -0.1633 | -0.999 | -5.63 | -2.13 | -2.13 | -2.13 | -2.13 | -2.13 |
| Total Cash | 7.8 | 2.3 | 1.5 | 3.0 | 1.1 | 3.8 | 4.0 | 4.2 | 4.5 | 4.8 |
| Total Cash, percent | .0 | .0 | .0 | .0 | .0 | .0 | .0 | .0 | .0 | .0 |
| Account Receivables | 3.5 | 4.1 | 6.6 | 5.5 | 4.4 | 5.3 | 5.6 | 5.9 | 6.3 | 6.7 |
| Account Receivables, % | 0.88199 | 0.85573 | 1.3 | 1.09 | 0.88937 | 1 | 1 | 1 | 1 | 1 |
| Inventories | 9.6 | 9.4 | 10.0 | 10.3 | 10.5 | 11.1 | 11.8 | 12.5 | 13.2 | 14.1 |
| Inventories, % | 2.45 | 1.98 | 1.97 | 2.04 | 2.13 | 2.11 | 2.11 | 2.11 | 2.11 | 2.11 |
| Accounts Payable | 6.4 | 15.5 | 15.3 | 16.7 | 13.2 | 14.6 | 15.5 | 16.4 | 17.4 | 18.5 |
| Accounts Payable, % | 1.63 | 3.27 | 3 | 3.32 | 2.67 | 2.78 | 2.78 | 2.78 | 2.78 | 2.78 |
| Capital Expenditure | -11.8 | -18.8 | -33.9 | -52.0 | -28.8 | -31.2 | -33.1 | -35.2 | -37.3 | -39.6 |
| Capital Expenditure, % | -2.99 | -3.95 | -6.65 | -10.34 | -5.83 | -5.95 | -5.95 | -5.95 | -5.95 | -5.95 |
| Tax Rate, % | -0.14934 | -0.14934 | -0.14934 | -0.14934 | -0.14934 | -0.14934 | -0.14934 | -0.14934 | -0.14934 | -0.14934 |
| EBITAT | -20.1 | 5.7 | -.8 | -5.0 | -27.8 | -11.1 | -11.8 | -12.5 | -13.3 | -14.1 |
| Depreciation | ||||||||||
| Changes in Account Receivables | ||||||||||
| Changes in Inventories | ||||||||||
| Changes in Accounts Payable | ||||||||||
| Capital Expenditure | ||||||||||
| UFCF | -16.9 | 18.1 | -14.9 | -28.0 | -30.2 | -15.1 | -16.1 | -17.1 | -18.2 | -19.3 |
| WACC, % | 4.47 | 4.41 | 4.47 | 4.47 | 4.47 | 4.46 | 4.46 | 4.46 | 4.46 | 4.46 |
| PV UFCF | ||||||||||
| SUM PV UFCF | -75.0 | |||||||||
| Long Term Growth Rate, % | 3.50 | |||||||||
| Free cash flow (T + 1) | -20 | |||||||||
| Terminal Value | -2,078 | |||||||||
| Present Terminal Value | -1,671 | |||||||||
| Enterprise Value | -1,746 | |||||||||
| Net Debt | 290 | |||||||||
| Equity Value | -2,036 | |||||||||
| Diluted Shares Outstanding, MM | 45 | |||||||||
| Equity Value Per Share | -44.79 |
What You Will Receive
- Comprehensive Financial Model: Noodles & Company's (NDLS) actual data facilitates accurate DCF valuation.
- Complete Forecast Flexibility: Modify revenue growth, profit margins, WACC, and other essential factors.
- Real-Time Calculations: Automatic updates provide immediate feedback as you adjust inputs.
- Professional-Grade Template: A polished Excel file crafted for top-tier valuation purposes.
- Adaptable and Reusable: Designed for versatility, allowing for repeated applications in detailed forecasting.
Key Features
- 🔍 Real-Life NDLS Financials: Pre-filled historical and projected data for Noodles & Company (NDLS).
- ✏️ Fully Customizable Inputs: Adjust all critical parameters (yellow cells) like WACC, growth %, and tax rates.
- 📊 Professional DCF Valuation: Built-in formulas calculate Noodles & Company’s intrinsic value using the Discounted Cash Flow method.
- ⚡ Instant Results: Visualize Noodles & Company’s valuation instantly after making changes.
- Scenario Analysis: Test and compare outcomes for various financial assumptions side-by-side.
How It Works
- Step 1: Download the Excel file.
- Step 2: Review pre-entered Noodles & Company (NDLS) data (historical and projected).
- Step 3: Adjust key assumptions (yellow cells) based on your analysis.
- Step 4: View automatic recalculations for Noodles & Company’s intrinsic value.
- Step 5: Use the outputs for investment decisions or reporting.
Why Choose This Calculator?
- Accurate Data: Real Noodles & Company financials ensure reliable valuation results.
- Customizable: Adjust key parameters like growth rates, WACC, and tax rates to align with your projections.
- Time-Saving: Pre-built calculations streamline the process, eliminating the need to start from scratch.
- Professional-Grade Tool: Tailored for investors, analysts, and consultants in the food industry.
- User-Friendly: Intuitive design and step-by-step guidance make it accessible for all users.
Who Should Use Noodles & Company's Services?
- Food Lovers: Enjoy a diverse menu that caters to all tastes and dietary preferences.
- Health-Conscious Diners: Choose from a variety of nutritious options that don't compromise on flavor.
- Families: Experience a family-friendly atmosphere with meals that appeal to both kids and adults.
- Busy Professionals: Take advantage of quick service and convenient takeout options for on-the-go meals.
- Students: Gather with friends for affordable and satisfying meals that fuel your studies.
What the Template Contains
- Comprehensive DCF Model: Editable template featuring detailed valuation calculations tailored for Noodles & Company (NDLS).
- Real-World Data: Noodles & Company’s historical and projected financials preloaded for thorough analysis.
- Customizable Parameters: Modify WACC, growth rates, and tax assumptions to explore various scenarios.
- Financial Statements: Complete annual and quarterly breakdowns for enhanced insights into performance.
- Key Ratios: Integrated analysis for profitability, efficiency, and leverage specific to Noodles & Company (NDLS).
- Dashboard with Visual Outputs: Interactive charts and tables for clear, actionable results.
Disclaimer
All information, articles, and product details provided on this website are for general informational and educational purposes only. We do not claim any ownership over, nor do we intend to infringe upon, any trademarks, copyrights, logos, brand names, or other intellectual property mentioned or depicted on this site. Such intellectual property remains the property of its respective owners, and any references here are made solely for identification or informational purposes, without implying any affiliation, endorsement, or partnership.
We make no representations or warranties, express or implied, regarding the accuracy, completeness, or suitability of any content or products presented. Nothing on this website should be construed as legal, tax, investment, financial, medical, or other professional advice. In addition, no part of this site—including articles or product references—constitutes a solicitation, recommendation, endorsement, advertisement, or offer to buy or sell any securities, franchises, or other financial instruments, particularly in jurisdictions where such activity would be unlawful.
All content is of a general nature and may not address the specific circumstances of any individual or entity. It is not a substitute for professional advice or services. Any actions you take based on the information provided here are strictly at your own risk. You accept full responsibility for any decisions or outcomes arising from your use of this website and agree to release us from any liability in connection with your use of, or reliance upon, the content or products found herein.