
|
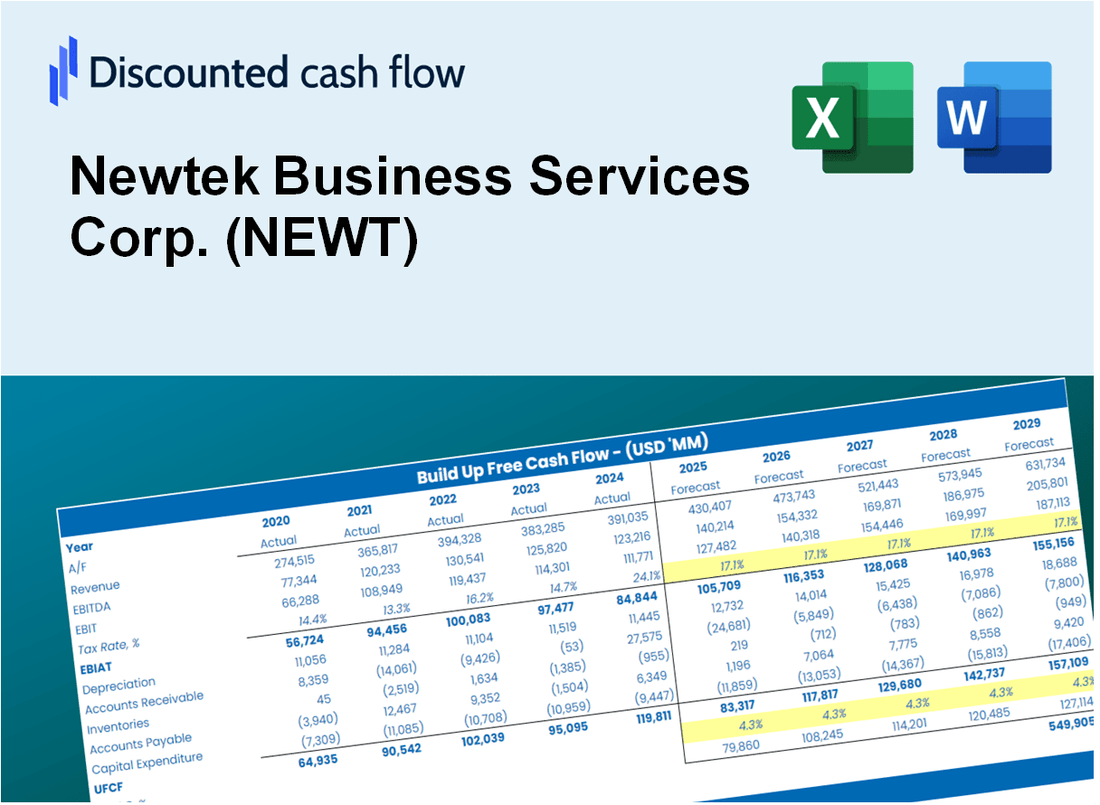
Newtek Business Services Corp. (Newt) DCF -Bewertung |
Fully Editable: Tailor To Your Needs In Excel Or Sheets
Professional Design: Trusted, Industry-Standard Templates
Investor-Approved Valuation Models
MAC/PC Compatible, Fully Unlocked
No Expertise Is Needed; Easy To Follow
Newtek Business Services Corp. (NEWT) Bundle
Gewinnen Sie mit unserem leistungsstarken DCF -Taschenrechner Einblick in Ihre NewTek Business Services Corp. (Newt) -Schanganalyse! Mit dieser Excel -Vorlage können Sie mit realen Daten (Newt-) Daten die Prognosen und Annahmen anpassen, um den inneren Wert der NewTek Business Services Corp. genau zu bestimmen.
Discounted Cash Flow (DCF) - (USD MM)
| Year | AY1 2020 |
AY2 2021 |
AY3 2022 |
AY4 2023 |
AY5 2024 |
FY1 2025 |
FY2 2026 |
FY3 2027 |
FY4 2028 |
FY5 2029 |
|---|---|---|---|---|---|---|---|---|---|---|
| Revenue | 75.0 | 168.3 | 131.5 | 253.1 | 333.5 | 502.3 | 756.5 | 1,139.3 | 1,715.8 | 2,584.0 |
| Revenue Growth, % | 0 | 124.49 | -21.86 | 92.51 | 31.76 | 50.6 | 50.6 | 50.6 | 50.6 | 50.6 |
| EBITDA | 52.0 | 106.5 | 65.8 | 125.7 | 122.9 | 270.4 | 407.2 | 613.2 | 923.5 | 1,390.8 |
| EBITDA, % | 69.31 | 63.3 | 50.01 | 49.66 | 36.85 | 53.82 | 53.82 | 53.82 | 53.82 | 53.82 |
| Depreciation | .4 | .3 | .2 | 2.9 | 1.8 | 2.6 | 3.9 | 5.9 | 8.8 | 13.3 |
| Depreciation, % | 0.53629 | 0.18066 | 0.18176 | 1.14 | 0.53488 | 0.51458 | 0.51458 | 0.51458 | 0.51458 | 0.51458 |
| EBIT | 51.6 | 106.2 | 65.5 | 122.8 | 121.1 | 267.8 | 403.3 | 607.3 | 914.6 | 1,377.5 |
| EBIT, % | 68.77 | 63.12 | 49.82 | 48.52 | 36.31 | 53.31 | 53.31 | 53.31 | 53.31 | 53.31 |
| Total Cash | 2.1 | 2.4 | 72.9 | 153.1 | 353.1 | 221.1 | 333.0 | 501.5 | 755.2 | 1,137.3 |
| Total Cash, percent | .0 | .0 | .0 | .0 | .0 | .0 | .0 | .0 | .0 | .0 |
| Account Receivables | 58.8 | 48.9 | .0 | 62.4 | 52.5 | 148.7 | 223.9 | 337.2 | 507.8 | 764.7 |
| Account Receivables, % | 78.5 | 29.08 | 0 | 24.66 | 15.73 | 29.59 | 29.59 | 29.59 | 29.59 | 29.59 |
| Inventories | .0 | .0 | .0 | .0 | .0 | .0 | .0 | .0 | .0 | .0 |
| Inventories, % | 0 | 0 | 0 | 0 | 0 | 0 | 0 | 0 | 0 | 0 |
| Accounts Payable | 3.6 | 3.1 | 13.4 | 7.9 | 9.2 | 22.8 | 34.4 | 51.8 | 77.9 | 117.4 |
| Accounts Payable, % | 4.8 | 1.83 | 10.19 | 3.12 | 2.76 | 4.54 | 4.54 | 4.54 | 4.54 | 4.54 |
| Capital Expenditure | .0 | .0 | .0 | -.5 | -.4 | -.3 | -.5 | -.8 | -1.1 | -1.7 |
| Capital Expenditure, % | -0.01334063 | 0 | -0.00836534 | -0.18093 | -0.13162 | -0.0668516 | -0.0668516 | -0.0668516 | -0.0668516 | -0.0668516 |
| Tax Rate, % | 25.97 | 25.97 | 25.97 | 25.97 | 25.97 | 25.97 | 25.97 | 25.97 | 25.97 | 25.97 |
| EBITAT | 53.1 | 104.6 | 54.6 | 128.1 | 89.7 | 244.1 | 367.6 | 553.6 | 833.8 | 1,255.7 |
| Depreciation | ||||||||||
| Changes in Account Receivables | ||||||||||
| Changes in Inventories | ||||||||||
| Changes in Accounts Payable | ||||||||||
| Capital Expenditure | ||||||||||
| UFCF | -1.7 | 114.3 | 114.1 | 62.6 | 102.3 | 163.8 | 307.3 | 462.9 | 697.1 | 1,049.8 |
| WACC, % | 9.99 | 9.87 | 8.72 | 9.99 | 8.01 | 9.32 | 9.32 | 9.32 | 9.32 | 9.32 |
| PV UFCF | ||||||||||
| SUM PV UFCF | 1,921.9 | |||||||||
| Long Term Growth Rate, % | 2.00 | |||||||||
| Free cash flow (T + 1) | 1,071 | |||||||||
| Terminal Value | 14,636 | |||||||||
| Present Terminal Value | 9,376 | |||||||||
| Enterprise Value | 11,298 | |||||||||
| Net Debt | 460 | |||||||||
| Equity Value | 10,838 | |||||||||
| Diluted Shares Outstanding, MM | 25 | |||||||||
| Equity Value Per Share | 430.32 |
What You Will Get
- Real NEWT Financial Data: Pre-filled with Newtek Business Services Corp.’s historical and projected data for precise analysis.
- Fully Editable Template: Modify key inputs like revenue growth, WACC, and EBITDA % with ease.
- Automatic Calculations: See Newtek’s intrinsic value update instantly based on your changes.
- Professional Valuation Tool: Designed for investors, analysts, and consultants seeking accurate DCF results.
- User-Friendly Design: Simple structure and clear instructions for all experience levels.
Key Features
- Comprehensive Financial Data: Gain access to precise historical data and future forecasts for Newtek Business Services Corp. (NEWT).
- Adjustable Forecast Parameters: Modify highlighted fields such as WACC, growth rates, and profit margins.
- Real-Time Calculations: Automatic recalculations for DCF, Net Present Value (NPV), and cash flow assessments.
- User-Friendly Dashboard: Intuitive charts and summaries for clear visualization of your valuation findings.
- Designed for All Levels: A straightforward layout tailored for investors, CFOs, and consultants alike.
How It Works
- Step 1: Download the Excel file.
- Step 2: Review Newtek Business Services Corp.'s (NEWT) pre-filled financial data and forecasts.
- Step 3: Modify key inputs such as revenue growth, WACC, and tax rates (highlighted cells).
- Step 4: Observe the DCF model update in real-time as you adjust assumptions.
- Step 5: Analyze the outputs and utilize the results for your investment decisions.
Why Choose Newtek Business Services Corp. (NEWT)?
- Streamlined Solutions: Access a comprehensive suite of services without the hassle of managing multiple vendors.
- Enhance Efficiency: Our expert team provides tailored support to optimize your business operations.
- Fully Adaptable: Customize our services to align with your specific business needs and goals.
- User-Friendly Interface: Intuitive tools and resources simplify complex processes for better decision-making.
- Proven Track Record: Trusted by a wide range of businesses for reliable and effective service delivery.
Who Should Use Newtek Business Services Corp. (NEWT)?
- Small Business Owners: Leverage expert services to streamline operations and enhance growth.
- Entrepreneurs: Access tailored financial solutions to support your startup journey.
- Investors: Evaluate investment opportunities with insights from a trusted business services provider.
- Financial Advisors: Utilize comprehensive resources to better serve your clients’ needs.
- Students and Educators: Explore real-world applications of business services in academic settings.
What the Template Contains
- Preloaded NEWT Data: Historical and projected financial data, including revenue, EBIT, and capital expenditures.
- DCF and WACC Models: Professional-grade sheets for calculating intrinsic value and Weighted Average Cost of Capital.
- Editable Inputs: Yellow-highlighted cells for adjusting revenue growth, tax rates, and discount rates.
- Financial Statements: Comprehensive annual and quarterly financials for deeper analysis.
- Key Ratios: Profitability, leverage, and efficiency ratios to evaluate performance.
- Dashboard and Charts: Visual summaries of valuation outcomes and assumptions.
Disclaimer
All information, articles, and product details provided on this website are for general informational and educational purposes only. We do not claim any ownership over, nor do we intend to infringe upon, any trademarks, copyrights, logos, brand names, or other intellectual property mentioned or depicted on this site. Such intellectual property remains the property of its respective owners, and any references here are made solely for identification or informational purposes, without implying any affiliation, endorsement, or partnership.
We make no representations or warranties, express or implied, regarding the accuracy, completeness, or suitability of any content or products presented. Nothing on this website should be construed as legal, tax, investment, financial, medical, or other professional advice. In addition, no part of this site—including articles or product references—constitutes a solicitation, recommendation, endorsement, advertisement, or offer to buy or sell any securities, franchises, or other financial instruments, particularly in jurisdictions where such activity would be unlawful.
All content is of a general nature and may not address the specific circumstances of any individual or entity. It is not a substitute for professional advice or services. Any actions you take based on the information provided here are strictly at your own risk. You accept full responsibility for any decisions or outcomes arising from your use of this website and agree to release us from any liability in connection with your use of, or reliance upon, the content or products found herein.