
|
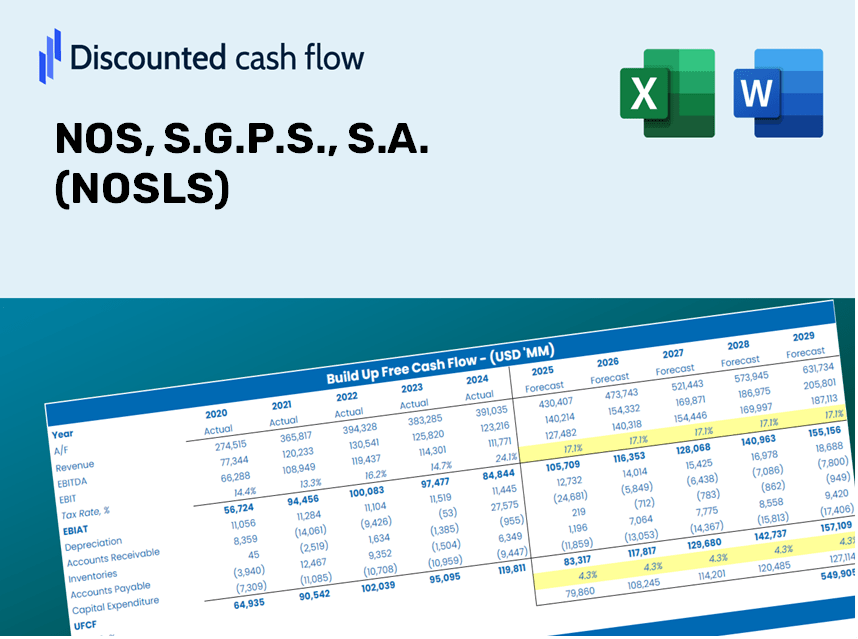
NOS, S.G.P.S., S.A. (NOS.LS) DCF -Bewertung |
Fully Editable: Tailor To Your Needs In Excel Or Sheets
Professional Design: Trusted, Industry-Standard Templates
Investor-Approved Valuation Models
MAC/PC Compatible, Fully Unlocked
No Expertise Is Needed; Easy To Follow
NOS, S.G.P.S., S.A. (NOS.LS) Bundle
Unser (NOSLS) DCF-Taschenrechner entwickelt für die Genauigkeit und ermöglicht es Ihnen, NOS, S.G.P.S., S.A. Bewertung unter Verwendung realer Finanzdaten zu bewerten und vollständige Flexibilität zu bieten, um alle wesentlichen Parameter für verbesserte Projektionen zu ändern.
Benefits You Will Receive
- Adjustable Forecast Parameters: Effortlessly modify assumptions (growth %, margins, WACC) to develop various scenarios.
- Comprehensive Data: NOS, S.G.P.S., S.A.'s financial information pre-filled to kickstart your analysis.
- Automated DCF Results: The template computes Net Present Value (NPV) and intrinsic value automatically.
- Flexible and Professional Design: A sleek Excel model tailored to meet your valuation requirements.
- Designed for Analysts and Investors: Perfect for evaluating projections, confirming strategies, and enhancing efficiency.
Key Features
- Advanced DCF Calculator: Features comprehensive unlevered and levered DCF valuation models tailored for NOS, S.G.P.S., S.A. (NOSLS).
- WACC Calculator: A pre-configured Weighted Average Cost of Capital sheet with customizable parameters specific to NOS, S.G.P.S., S.A. (NOSLS).
- Customizable Forecast Assumptions: Easily adjust growth rates, capital expenditures, and discount rates as applicable to NOS, S.G.P.S., S.A. (NOSLS).
- Integrated Financial Ratios: Evaluate profitability, leverage, and efficiency ratios focused on NOS, S.G.P.S., S.A. (NOSLS).
- Dashboard and Visualizations: Graphical representations that highlight crucial valuation metrics for straightforward analysis of NOS, S.G.P.S., S.A. (NOSLS).
How It Operates
- Download the Template: Gain immediate access to the Excel-based NOS DCF Calculator.
- Enter Your Assumptions: Modify the yellow-highlighted cells to set growth rates, WACC, profit margins, and other variables.
- Real-Time Calculations: The model automatically computes the intrinsic value of NOS (NOSLS).
- Explore Different Scenarios: Test various assumptions to assess potential changes in valuation.
- Evaluate and Decide: Utilize the findings to inform your investment strategies or financial assessments.
Why Opt for the NOS Calculator?
- Precision: Utilizes real NOS financial data to ensure accuracy.
- Versatility: Built for users to easily adjust and experiment with inputs.
- Efficiency: Avoid the complexity of constructing a DCF model from the ground up.
- Expert-Level: Crafted with the precision and user experience akin to CFO standards.
- Intuitive: Designed to be straightforward, making it accessible for users without extensive financial modeling knowledge.
Who Should Utilize This Product?
- Investors: Evaluate NOS's valuation prior to making stock transactions.
- CFOs and Financial Analysts: Optimize valuation workflows and assess financial projections.
- Startup Founders: Understand how established public companies like NOS are appraised.
- Consultants: Provide comprehensive valuation reports for your clients.
- Students and Educators: Leverage real-time data to practice and teach valuation methodologies.
Contents of the Template
- Pre-Filled Data: Contains NOS, S.G.P.S., S.A.'s historical financials and projections.
- Discounted Cash Flow Model: An editable DCF valuation model featuring automatic calculations.
- Weighted Average Cost of Capital (WACC): A dedicated worksheet for WACC calculation based on user-defined inputs.
- Key Financial Ratios: Assess NOS's profitability, efficiency, and leverage metrics.
- Customizable Inputs: Easily modify revenue growth, margins, and tax rates.
- User-Friendly Dashboard: Visuals and tables summarizing essential valuation results.
Disclaimer
All information, articles, and product details provided on this website are for general informational and educational purposes only. We do not claim any ownership over, nor do we intend to infringe upon, any trademarks, copyrights, logos, brand names, or other intellectual property mentioned or depicted on this site. Such intellectual property remains the property of its respective owners, and any references here are made solely for identification or informational purposes, without implying any affiliation, endorsement, or partnership.
We make no representations or warranties, express or implied, regarding the accuracy, completeness, or suitability of any content or products presented. Nothing on this website should be construed as legal, tax, investment, financial, medical, or other professional advice. In addition, no part of this site—including articles or product references—constitutes a solicitation, recommendation, endorsement, advertisement, or offer to buy or sell any securities, franchises, or other financial instruments, particularly in jurisdictions where such activity would be unlawful.
All content is of a general nature and may not address the specific circumstances of any individual or entity. It is not a substitute for professional advice or services. Any actions you take based on the information provided here are strictly at your own risk. You accept full responsibility for any decisions or outcomes arising from your use of this website and agree to release us from any liability in connection with your use of, or reliance upon, the content or products found herein.