
|
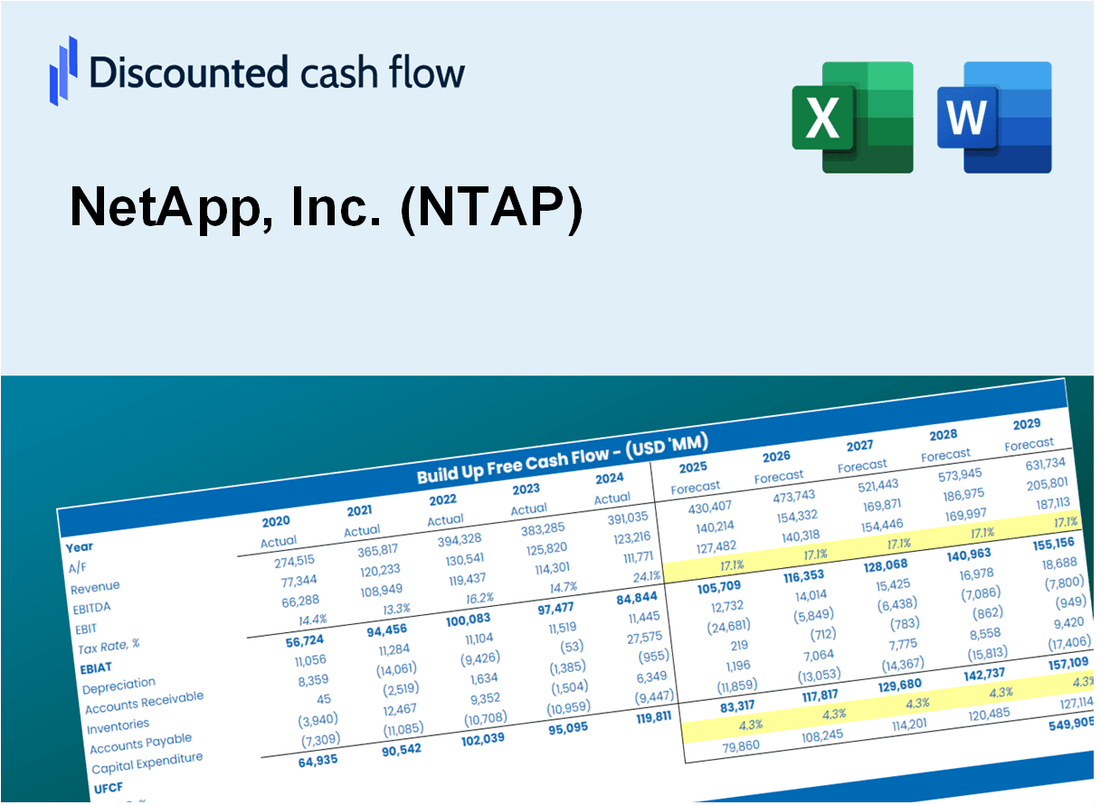
NetApp, Inc. (NTAP) DCF -Bewertung |
Fully Editable: Tailor To Your Needs In Excel Or Sheets
Professional Design: Trusted, Industry-Standard Templates
Investor-Approved Valuation Models
MAC/PC Compatible, Fully Unlocked
No Expertise Is Needed; Easy To Follow
NetApp, Inc. (NTAP) Bundle
Unabhängig davon, ob Sie ein Investor oder ein Analyst sind, ist dieser (NTAP) DCF-Taschenrechner Ihre Anlaufstelle für eine genaue Bewertung. Ausgestattet mit realen Daten von NetApp, Inc. können Sie problemlos Prognosen anpassen und die Auswirkungen in Echtzeit beobachten.
What You Will Get
- Real NetApp Data: Preloaded financials – from revenue to EBIT – based on actual and projected figures.
- Full Customization: Adjust all critical parameters (yellow cells) like WACC, growth %, and tax rates.
- Instant Valuation Updates: Automatic recalculations to analyze the impact of changes on NetApp’s fair value.
- Versatile Excel Template: Tailored for quick edits, scenario testing, and detailed projections.
- Time-Saving and Accurate: Skip building models from scratch while maintaining precision and flexibility.
Key Features
- Real-Life NTAP Data: Pre-filled with NetApp’s historical financials and forward-looking projections.
- Fully Customizable Inputs: Adjust revenue growth, margins, WACC, tax rates, and capital expenditures.
- Dynamic Valuation Model: Automatic updates to Net Present Value (NPV) and intrinsic value based on your inputs.
- Scenario Testing: Create multiple forecast scenarios to analyze different valuation outcomes.
- User-Friendly Design: Simple, structured, and designed for professionals and beginners alike.
How It Works
- Step 1: Download the Excel file.
- Step 2: Review pre-entered NetApp data (historical and projected).
- Step 3: Adjust key assumptions (yellow cells) based on your analysis.
- Step 4: View automatic recalculations for NetApp’s intrinsic value.
- Step 5: Use the outputs for investment decisions or reporting.
Why Choose NetApp, Inc. (NTAP)?
- Streamline Your Data Management: Simplify storage and data operations with our advanced solutions.
- Enhance Performance: Optimize your infrastructure for superior speed and efficiency.
- Scalable Solutions: Easily adapt our services to meet your growing business needs.
- User-Friendly Interface: Intuitive design ensures seamless navigation and usability.
- Industry-Leading Support: Rely on our expert team for guidance and assistance when needed.
Who Should Use This Product?
- Professional Investors: Develop comprehensive and accurate valuation models for portfolio assessment of NetApp, Inc. (NTAP).
- Corporate Finance Teams: Evaluate valuation scenarios to inform strategic decisions within the organization.
- Consultants and Advisors: Deliver precise valuation insights for clients interested in NetApp, Inc. (NTAP).
- Students and Educators: Utilize real-world data to enhance learning and practice in financial modeling.
- Tech Enthusiasts: Gain insights into how technology firms like NetApp, Inc. (NTAP) are valued in the marketplace.
What the Template Contains
- Pre-Filled DCF Model: NetApp, Inc.'s (NTAP) financial data preloaded for immediate use.
- WACC Calculator: Detailed calculations for Weighted Average Cost of Capital.
- Financial Ratios: Evaluate NetApp, Inc.'s (NTAP) profitability, leverage, and efficiency.
- Editable Inputs: Change assumptions such as growth, margins, and CAPEX to fit your scenarios.
- Financial Statements: Annual and quarterly reports to support detailed analysis.
- Interactive Dashboard: Easily visualize key valuation metrics and results.
Disclaimer
All information, articles, and product details provided on this website are for general informational and educational purposes only. We do not claim any ownership over, nor do we intend to infringe upon, any trademarks, copyrights, logos, brand names, or other intellectual property mentioned or depicted on this site. Such intellectual property remains the property of its respective owners, and any references here are made solely for identification or informational purposes, without implying any affiliation, endorsement, or partnership.
We make no representations or warranties, express or implied, regarding the accuracy, completeness, or suitability of any content or products presented. Nothing on this website should be construed as legal, tax, investment, financial, medical, or other professional advice. In addition, no part of this site—including articles or product references—constitutes a solicitation, recommendation, endorsement, advertisement, or offer to buy or sell any securities, franchises, or other financial instruments, particularly in jurisdictions where such activity would be unlawful.
All content is of a general nature and may not address the specific circumstances of any individual or entity. It is not a substitute for professional advice or services. Any actions you take based on the information provided here are strictly at your own risk. You accept full responsibility for any decisions or outcomes arising from your use of this website and agree to release us from any liability in connection with your use of, or reliance upon, the content or products found herein.