
|
Nexpoint Residential Trust, Inc. (NXRT) DCF -Bewertung |
Fully Editable: Tailor To Your Needs In Excel Or Sheets
Professional Design: Trusted, Industry-Standard Templates
Investor-Approved Valuation Models
MAC/PC Compatible, Fully Unlocked
No Expertise Is Needed; Easy To Follow
NexPoint Residential Trust, Inc. (NXRT) Bundle
Erwerben Sie die volle Kontrolle über Ihre NEXPoint Residential Trust, Inc. (NXRT) Bewertungsanalyse mit unserem ausgefeilten DCF -Taschenrechner! Mit dieser Excel -Vorlage, die mit realen (NXRT) -Daten ausgestattet ist, können Sie Prognosen und Annahmen anpassen, um den inneren Wert von Nexpoint Residential Trust, Inc.
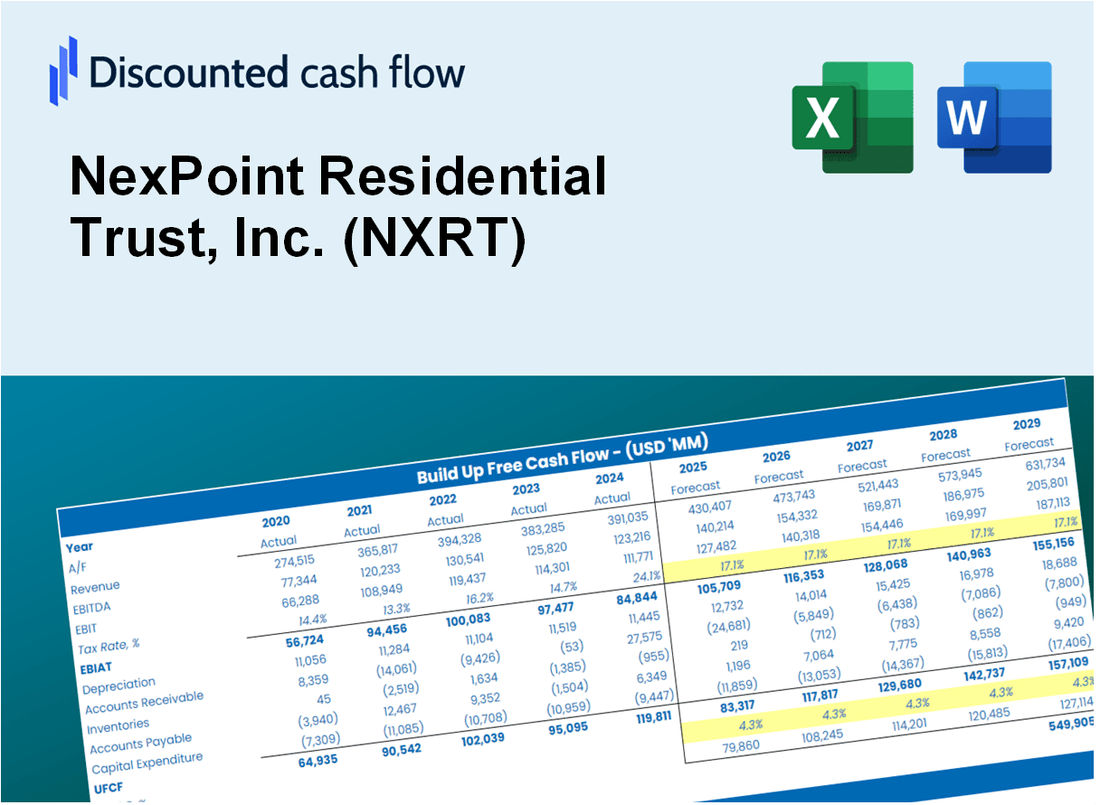
Discounted Cash Flow (DCF) - (USD MM)
| Year | AY1 2020 |
AY2 2021 |
AY3 2022 |
AY4 2023 |
AY5 2024 |
FY1 2025 |
FY2 2026 |
FY3 2027 |
FY4 2028 |
FY5 2029 |
|---|---|---|---|---|---|---|---|---|---|---|
| Revenue | 204.8 | 219.2 | 264.0 | 277.5 | 259.7 | 276.7 | 294.8 | 314.1 | 334.6 | 356.5 |
| Revenue Growth, % | 0 | 7.05 | 20.39 | 5.14 | -6.42 | 6.54 | 6.54 | 6.54 | 6.54 | 6.54 |
| EBITDA | 96.0 | 105.1 | 132.7 | 250.0 | 128.6 | 157.5 | 167.8 | 178.8 | 190.5 | 203.0 |
| EBITDA, % | 46.86 | 47.93 | 50.26 | 90.09 | 49.53 | 56.93 | 56.93 | 56.93 | 56.93 | 56.93 |
| Depreciation | 82.4 | 86.9 | 97.6 | 95.2 | 97.8 | 104.5 | 111.3 | 118.6 | 126.4 | 134.6 |
| Depreciation, % | 40.24 | 39.63 | 36.99 | 34.3 | 37.64 | 37.76 | 37.76 | 37.76 | 37.76 | 37.76 |
| EBIT | 13.6 | 18.2 | 35.0 | 154.8 | 30.9 | 53.1 | 56.5 | 60.2 | 64.2 | 68.4 |
| EBIT, % | 6.62 | 8.31 | 13.27 | 55.79 | 11.89 | 19.17 | 19.17 | 19.17 | 19.17 | 19.17 |
| Total Cash | 24.5 | 53.2 | 127.8 | 12.4 | 23.1 | 54.2 | 57.8 | 61.6 | 65.6 | 69.9 |
| Total Cash, percent | .0 | .0 | .0 | .0 | .0 | .0 | .0 | .0 | .0 | .0 |
| Account Receivables | 9.0 | 4.8 | 17.1 | 14.6 | 12.3 | 12.8 | 13.6 | 14.5 | 15.5 | 16.5 |
| Account Receivables, % | 4.42 | 2.21 | 6.49 | 5.26 | 4.75 | 4.62 | 4.62 | 4.62 | 4.62 | 4.62 |
| Inventories | .0 | .0 | .0 | .0 | .0 | .0 | .0 | .0 | .0 | .0 |
| Inventories, % | -0.00146484 | 0 | 0 | 0 | 0 | -0.00029296875 | -0.00029296875 | -0.00029296875 | -0.00029296875 | -0.00029296875 |
| Accounts Payable | 10.1 | 12.6 | 12.3 | 17.1 | 11.4 | 14.3 | 15.3 | 16.2 | 17.3 | 18.4 |
| Accounts Payable, % | 4.91 | 5.74 | 4.67 | 6.18 | 4.37 | 5.17 | 5.17 | 5.17 | 5.17 | 5.17 |
| Capital Expenditure | .0 | .0 | .0 | .0 | .0 | .0 | .0 | .0 | .0 | .0 |
| Capital Expenditure, % | 0 | 0 | 0 | 0 | 0 | 0 | 0 | 0 | 0 | 0 |
| Tax Rate, % | 0 | 0 | 0 | 0 | 0 | 0 | 0 | 0 | 0 | 0 |
| EBITAT | 13.5 | 18.2 | 34.9 | 154.2 | 30.9 | 52.9 | 56.4 | 60.1 | 64.0 | 68.2 |
| Depreciation | ||||||||||
| Changes in Account Receivables | ||||||||||
| Changes in Inventories | ||||||||||
| Changes in Accounts Payable | ||||||||||
| Capital Expenditure | ||||||||||
| UFCF | 97.0 | 111.8 | 120.0 | 256.8 | 125.1 | 159.9 | 167.8 | 178.8 | 190.5 | 202.9 |
| WACC, % | 7.91 | 7.91 | 7.9 | 7.9 | 7.92 | 7.91 | 7.91 | 7.91 | 7.91 | 7.91 |
| PV UFCF | ||||||||||
| SUM PV UFCF | 713.7 | |||||||||
| Long Term Growth Rate, % | 2.00 | |||||||||
| Free cash flow (T + 1) | 207 | |||||||||
| Terminal Value | 3,504 | |||||||||
| Present Terminal Value | 2,395 | |||||||||
| Enterprise Value | 3,109 | |||||||||
| Net Debt | 1,441 | |||||||||
| Equity Value | 1,668 | |||||||||
| Diluted Shares Outstanding, MM | 26 | |||||||||
| Equity Value Per Share | 63.56 |
What You Will Get
- Real NexPoint Data: Preloaded financials – from revenue to EBIT – based on actual and projected figures for NexPoint Residential Trust, Inc. (NXRT).
- Full Customization: Adjust all critical parameters (yellow cells) like WACC, growth %, and tax rates to fit your analysis needs.
- Instant Valuation Updates: Automatic recalculations to assess the impact of changes on NexPoint's fair value.
- Versatile Excel Template: Designed for quick edits, scenario testing, and detailed financial projections.
- Time-Saving and Accurate: Avoid the hassle of building models from scratch while ensuring precision and flexibility.
Key Features
- Comprehensive NXRT Financials: Gain access to precise pre-loaded historical data and future forecasts.
- Adjustable Forecast Inputs: Modify yellow-highlighted fields such as WACC, growth rates, and profit margins.
- Real-Time Calculations: Automatic updates for DCF, Net Present Value (NPV), and cash flow assessments.
- Interactive Dashboard: User-friendly charts and summaries to help you visualize your valuation outcomes.
- Suitable for All Levels: A straightforward, intuitive design tailored for investors, CFOs, and consultants alike.
How It Works
- Step 1: Download the Excel file.
- Step 2: Review NexPoint Residential Trust, Inc.'s (NXRT) pre-filled financial data and forecasts.
- Step 3: Modify key inputs such as rental growth, capitalization rates, and operating expenses (highlighted cells).
- Step 4: Observe the DCF model update in real-time as you adjust your assumptions.
- Step 5: Evaluate the outputs and leverage the results for your investment strategies.
Why Choose This Calculator?
- Accuracy: Real NexPoint Residential Trust, Inc. (NXRT) financials ensure data accuracy.
- Flexibility: Designed for users to test and modify inputs freely.
- Time-Saving: Skip the hassle of building a DCF model from scratch.
- Professional-Grade: Developed with CFO-level precision and usability in mind.
- User-Friendly: Easy to use, even for those without advanced financial modeling experience.
Who Should Use NexPoint Residential Trust, Inc. (NXRT)?
- Real Estate Investors: Enhance your investment strategies with accurate property valuation insights.
- Financial Analysts: Streamline your analysis with our comprehensive financial modeling tools.
- Consultants: Efficiently tailor reports and presentations for your clients in the residential market.
- Real Estate Enthusiasts: Expand your knowledge of market trends and valuation methods through practical examples.
- Educators and Students: Utilize our resources as an effective teaching aid in real estate and finance courses.
What the Template Contains
- Historical Data: Includes NexPoint Residential Trust, Inc.'s (NXRT) past financials and baseline forecasts.
- DCF and Levered DCF Models: Detailed templates to calculate NexPoint Residential Trust, Inc.'s (NXRT) intrinsic value.
- WACC Sheet: Pre-built calculations for Weighted Average Cost of Capital.
- Editable Inputs: Modify key drivers like growth rates, EBITDA %, and CAPEX assumptions.
- Quarterly and Annual Statements: A complete breakdown of NexPoint Residential Trust, Inc.'s (NXRT) financials.
- Interactive Dashboard: Visualize valuation results and projections dynamically.
Disclaimer
All information, articles, and product details provided on this website are for general informational and educational purposes only. We do not claim any ownership over, nor do we intend to infringe upon, any trademarks, copyrights, logos, brand names, or other intellectual property mentioned or depicted on this site. Such intellectual property remains the property of its respective owners, and any references here are made solely for identification or informational purposes, without implying any affiliation, endorsement, or partnership.
We make no representations or warranties, express or implied, regarding the accuracy, completeness, or suitability of any content or products presented. Nothing on this website should be construed as legal, tax, investment, financial, medical, or other professional advice. In addition, no part of this site—including articles or product references—constitutes a solicitation, recommendation, endorsement, advertisement, or offer to buy or sell any securities, franchises, or other financial instruments, particularly in jurisdictions where such activity would be unlawful.
All content is of a general nature and may not address the specific circumstances of any individual or entity. It is not a substitute for professional advice or services. Any actions you take based on the information provided here are strictly at your own risk. You accept full responsibility for any decisions or outcomes arising from your use of this website and agree to release us from any liability in connection with your use of, or reliance upon, the content or products found herein.