
|
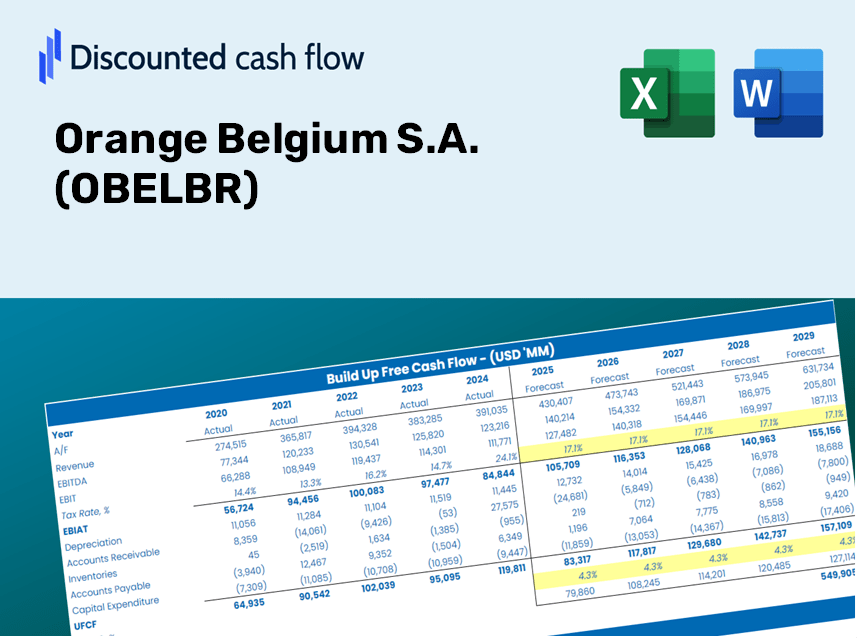
Orange Belgien S.A. (OBEL.BR) DCF -Bewertung |
Fully Editable: Tailor To Your Needs In Excel Or Sheets
Professional Design: Trusted, Industry-Standard Templates
Investor-Approved Valuation Models
MAC/PC Compatible, Fully Unlocked
No Expertise Is Needed; Easy To Follow
Orange Belgium S.A. (OBEL.BR) Bundle
Optimieren Sie Ihre Zeit und verbessern Sie die Präzision mit unserem (OBELBR) DCF -Taschenrechner! Mithilfe realer Daten von Orange Belgium S.A. und anpassbaren Annahmen können Sie orange Belgien wie ein erfahrener Investor prognostizieren, analysieren und bewerten.
Discounted Cash Flow (DCF) - (USD MM)
| Year | AY1 2020 |
AY2 2021 |
AY3 2022 |
AY4 2023 |
AY5 2024 |
FY1 2025 |
FY2 2026 |
FY3 2027 |
FY4 2028 |
FY5 2029 |
|---|---|---|---|---|---|---|---|---|---|---|
| Revenue | 1,284.4 | 1,328.2 | 1,391.2 | 1,749.5 | 1,993.8 | 2,232.4 | 2,499.6 | 2,798.8 | 3,133.8 | 3,508.9 |
| Revenue Growth, % | 0 | 3.41 | 4.74 | 25.75 | 13.97 | 11.97 | 11.97 | 11.97 | 11.97 | 11.97 |
| EBITDA | 372.1 | 389.0 | 396.0 | 471.2 | 591.1 | 639.8 | 716.4 | 802.2 | 898.2 | 1,005.7 |
| EBITDA, % | 28.97 | 29.29 | 28.46 | 26.93 | 29.65 | 28.66 | 28.66 | 28.66 | 28.66 | 28.66 |
| Depreciation | 302.7 | 333.3 | 300.3 | 392.8 | 472.7 | 519.8 | 582.0 | 651.6 | 729.6 | 816.9 |
| Depreciation, % | 23.57 | 25.09 | 21.58 | 22.45 | 23.71 | 23.28 | 23.28 | 23.28 | 23.28 | 23.28 |
| EBIT | 69.4 | 55.7 | 95.7 | 78.4 | 118.4 | 120.1 | 134.5 | 150.6 | 168.6 | 188.8 |
| EBIT, % | 5.4 | 4.2 | 6.88 | 4.48 | 5.94 | 5.38 | 5.38 | 5.38 | 5.38 | 5.38 |
| Total Cash | 61.2 | 54.2 | 35.9 | 47.7 | 60.4 | 76.7 | 85.9 | 96.1 | 107.7 | 120.5 |
| Total Cash, percent | .0 | .0 | .0 | .0 | .0 | .0 | .0 | .0 | .0 | .0 |
| Account Receivables | 272.4 | 238.8 | 226.4 | 306.6 | 330.5 | 399.9 | 447.7 | 501.3 | 561.3 | 628.5 |
| Account Receivables, % | 21.21 | 17.98 | 16.27 | 17.52 | 16.58 | 17.91 | 17.91 | 17.91 | 17.91 | 17.91 |
| Inventories | 26.7 | 24.0 | 25.5 | 51.4 | 34.8 | 46.4 | 52.0 | 58.2 | 65.2 | 73.0 |
| Inventories, % | 2.08 | 1.81 | 1.83 | 2.94 | 1.74 | 2.08 | 2.08 | 2.08 | 2.08 | 2.08 |
| Accounts Payable | 296.5 | 258.8 | 223.9 | 283.2 | 286.1 | 398.3 | 445.9 | 499.3 | 559.1 | 626.0 |
| Accounts Payable, % | 23.09 | 19.49 | 16.09 | 16.19 | 14.35 | 17.84 | 17.84 | 17.84 | 17.84 | 17.84 |
| Capital Expenditure | -177.7 | -225.9 | -776.9 | -304.1 | -368.5 | -547.2 | -612.7 | -686.0 | -768.1 | -860.1 |
| Capital Expenditure, % | -13.84 | -17.01 | -55.84 | -17.38 | -18.48 | -24.51 | -24.51 | -24.51 | -24.51 | -24.51 |
| Tax Rate, % | -418.09 | -418.09 | -418.09 | -418.09 | -418.09 | -418.09 | -418.09 | -418.09 | -418.09 | -418.09 |
| EBITAT | 58.4 | 42.2 | 68.2 | -1.6 | 613.5 | 79.5 | 89.1 | 99.7 | 111.7 | 125.0 |
| Depreciation | ||||||||||
| Changes in Account Receivables | ||||||||||
| Changes in Inventories | ||||||||||
| Changes in Accounts Payable | ||||||||||
| Capital Expenditure | ||||||||||
| UFCF | 180.9 | 148.1 | -432.4 | 40.3 | 713.3 | 83.2 | 52.6 | 58.9 | 65.9 | 73.8 |
| WACC, % | 4.78 | 4.49 | 4.35 | 1.93 | 5.32 | 4.18 | 4.18 | 4.18 | 4.18 | 4.18 |
| PV UFCF | ||||||||||
| SUM PV UFCF | 296.6 | |||||||||
| Long Term Growth Rate, % | 2.00 | |||||||||
| Free cash flow (T + 1) | 75 | |||||||||
| Terminal Value | 3,462 | |||||||||
| Present Terminal Value | 2,822 | |||||||||
| Enterprise Value | 3,118 | |||||||||
| Net Debt | 2,085 | |||||||||
| Equity Value | 1,033 | |||||||||
| Diluted Shares Outstanding, MM | 65 | |||||||||
| Equity Value Per Share | 15.92 |
Benefits You'll Receive
- Pre-Filled Financial Model: Utilizes Orange Belgium S.A.'s (OBELBR) actual data for accurate DCF valuation.
- Full Forecast Control: Modify revenue growth, profit margins, WACC, and other essential drivers.
- Instant Calculations: Automatic updates let you see changes in real time.
- Investor-Ready Template: A polished Excel file crafted for professional valuation standards.
- Customizable and Reusable: Designed for flexibility, perfect for repeated use in detailed forecasting.
Key Features
- Advanced DCF Calculator: Features comprehensive unlevered and levered DCF valuation models.
- WACC Calculator: Pre-configured Weighted Average Cost of Capital sheet with adjustable inputs.
- Editable Forecast Assumptions: Customize growth rates, capital expenditures, and discount rates.
- Built-In Financial Ratios: Evaluate profitability, leverage, and efficiency ratios for Orange Belgium S.A. (OBELBR).
- Dashboard and Charts: Visual displays present key valuation metrics for straightforward analysis.
How It Functions
- Download the Template: Gain immediate access to the Excel-based OBELBR DCF Calculator.
- Input Your Assumptions: Modify the yellow-highlighted cells to set your growth rates, WACC, margins, and more.
- Instant Calculations: The model will automatically refresh to reflect Orange Belgium’s intrinsic value.
- Test Scenarios: Experiment with various assumptions to assess potential changes in valuation.
- Analyze and Decide: Utilize the outcomes to support your investment or financial decisions.
Why Opt for This Calculator?
- Designed for Experts: A sophisticated tool tailored for analysts, CFOs, and consultants.
- Comprehensive Data: Orange Belgium S.A.'s (OBELBR) historical and projected financials are readily available for precise analysis.
- Forecast Simulation: Effortlessly test various scenarios and assumptions.
- Transparent Results: Instantly calculates intrinsic value, NPV, and essential metrics.
- User-Friendly: Detailed instructions ensure a smooth and straightforward experience.
Who Can Benefit from This Product?
- Individual Investors: Make educated choices regarding the purchase or sale of Orange Belgium S.A. (OBELBR) shares.
- Financial Analysts: Enhance valuation workflows with pre-built financial models.
- Consultants: Provide clients with reliable valuation insights swiftly and precisely.
- Business Owners: Gain insights into the valuation methods of major companies like Orange Belgium S.A. (OBELBR) to inform your business strategy.
- Finance Students: Acquire valuation skills using real-world data and practical examples.
What the Template Contains
- Historical Data: Includes Orange Belgium S.A.'s (OBELBR) past financials and baseline forecasts.
- DCF and Levered DCF Models: Detailed templates to calculate Orange Belgium S.A.'s (OBELBR) intrinsic value.
- WACC Sheet: Pre-built calculations for Weighted Average Cost of Capital.
- Editable Inputs: Modify key drivers like growth rates, EBITDA %, and CAPEX assumptions.
- Quarterly and Annual Statements: A complete breakdown of Orange Belgium S.A.'s (OBELBR) financials.
- Interactive Dashboard: Visualize valuation results and projections dynamically.
Disclaimer
All information, articles, and product details provided on this website are for general informational and educational purposes only. We do not claim any ownership over, nor do we intend to infringe upon, any trademarks, copyrights, logos, brand names, or other intellectual property mentioned or depicted on this site. Such intellectual property remains the property of its respective owners, and any references here are made solely for identification or informational purposes, without implying any affiliation, endorsement, or partnership.
We make no representations or warranties, express or implied, regarding the accuracy, completeness, or suitability of any content or products presented. Nothing on this website should be construed as legal, tax, investment, financial, medical, or other professional advice. In addition, no part of this site—including articles or product references—constitutes a solicitation, recommendation, endorsement, advertisement, or offer to buy or sell any securities, franchises, or other financial instruments, particularly in jurisdictions where such activity would be unlawful.
All content is of a general nature and may not address the specific circumstances of any individual or entity. It is not a substitute for professional advice or services. Any actions you take based on the information provided here are strictly at your own risk. You accept full responsibility for any decisions or outcomes arising from your use of this website and agree to release us from any liability in connection with your use of, or reliance upon, the content or products found herein.