
|
OFS Credit Company, Inc. (OCCI) DCF -Bewertung |
Fully Editable: Tailor To Your Needs In Excel Or Sheets
Professional Design: Trusted, Industry-Standard Templates
Investor-Approved Valuation Models
MAC/PC Compatible, Fully Unlocked
No Expertise Is Needed; Easy To Follow
OFS Credit Company, Inc. (OCCI) Bundle
Möchten Sie den inneren Wert von OFS Credit Company, Inc. bewerten? Unser (OCCI) DCF-Taschenrechner verschmilzt reale Daten mit umfangreichen Anpassungsfunktionen, sodass Sie Prognosen anpassen und Ihre Anlagestrategien verbessern können.
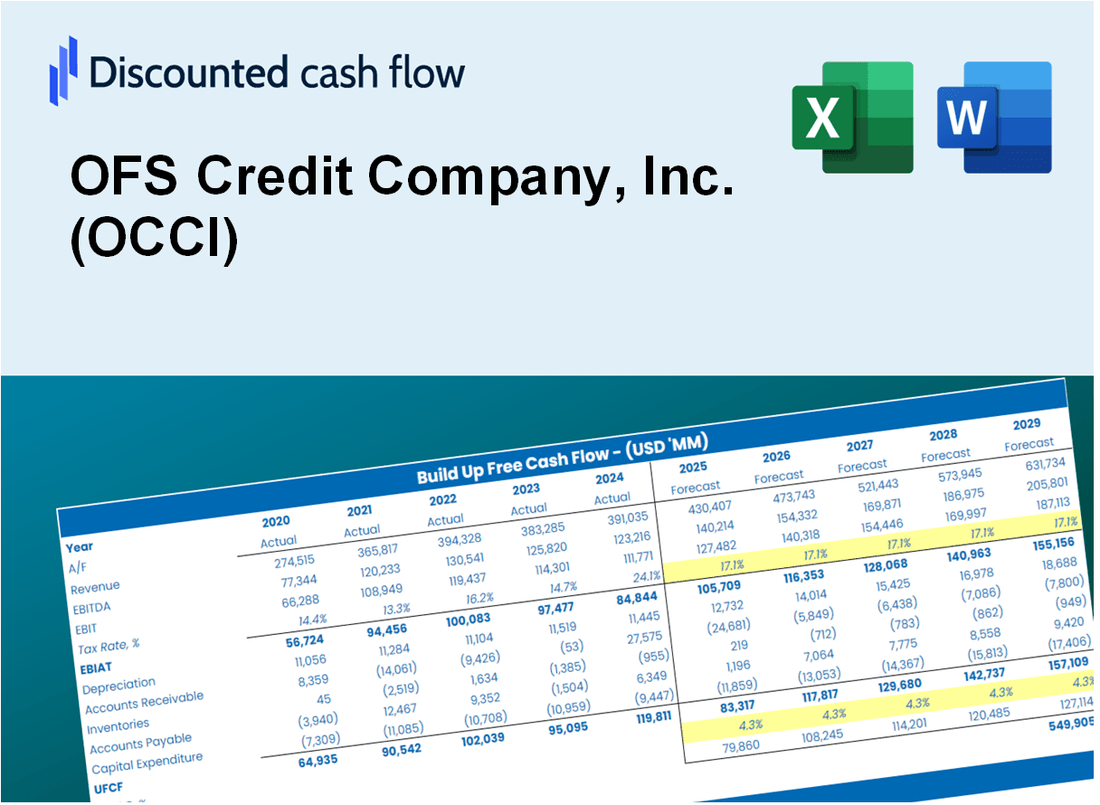
Discounted Cash Flow (DCF) - (USD MM)
| Year | AY1 2020 |
AY2 2021 |
AY3 2022 |
AY4 2023 |
AY5 2024 |
FY1 2025 |
FY2 2026 |
FY3 2027 |
FY4 2028 |
FY5 2029 |
|---|---|---|---|---|---|---|---|---|---|---|
| Revenue | -1.6 | 23.0 | 26.2 | 30.7 | 18.7 | 13.6 | 10.0 | 7.3 | 5.3 | 3.9 |
| Revenue Growth, % | 0 | -1504.13 | 14.15 | 17.07 | -39.13 | -26.98 | -26.98 | -26.98 | -26.98 | -26.98 |
| EBITDA | -2.0 | 20.3 | -13.6 | -.2 | 12.2 | 5.5 | 4.0 | 2.9 | 2.1 | 1.6 |
| EBITDA, % | 125 | 88.41 | -51.81 | -0.4967 | 65.08 | 40.24 | 40.24 | 40.24 | 40.24 | 40.24 |
| Depreciation | .0 | -7.5 | -17.3 | 6.9 | -21.5 | -4.8 | -3.5 | -2.6 | -1.9 | -1.4 |
| Depreciation, % | 0 | -32.55 | -66.02 | 22.55 | -115.13 | -35.2 | -35.2 | -35.2 | -35.2 | -35.2 |
| EBIT | -2.0 | 27.8 | 3.7 | -7.1 | 33.7 | 7.9 | 5.8 | 4.2 | 3.1 | 2.3 |
| EBIT, % | 125 | 120.96 | 14.2 | -23.05 | 180.21 | 58.23 | 58.23 | 58.23 | 58.23 | 58.23 |
| Total Cash | 6.4 | 15.0 | 12.5 | 16.8 | 24.7 | 4.6 | 3.3 | 2.4 | 1.8 | 1.3 |
| Total Cash, percent | .0 | .0 | .0 | .0 | .0 | .0 | .0 | .0 | .0 | .0 |
| Account Receivables | .0 | .3 | .6 | .8 | .3 | .2 | .2 | .1 | .1 | .1 |
| Account Receivables, % | 0 | 1.26 | 2.32 | 2.71 | 1.51 | 1.56 | 1.56 | 1.56 | 1.56 | 1.56 |
| Inventories | .0 | .0 | .0 | .0 | .0 | .0 | .0 | .0 | .0 | .0 |
| Inventories, % | 0 | 0 | 0 | 0 | 0 | 0 | 0 | 0 | 0 | 0 |
| Accounts Payable | .0 | 5.9 | .6 | .0 | .0 | .8 | .6 | .4 | .3 | .2 |
| Accounts Payable, % | 0 | 25.68 | 2.32 | 0 | 0 | 5.6 | 5.6 | 5.6 | 5.6 | 5.6 |
| Capital Expenditure | .0 | .0 | .0 | .0 | .0 | .0 | .0 | .0 | .0 | .0 |
| Capital Expenditure, % | -0.000244507296 | 0 | 0 | 0 | 0 | -0.000048901459 | -0.000048901459 | -0.000048901459 | -0.000048901459 | -0.000048901459 |
| Tax Rate, % | 0 | 0 | 0 | 0 | 0 | 0 | 0 | 0 | 0 | 0 |
| EBITAT | -2.0 | 27.8 | 3.7 | -7.1 | 33.7 | 7.9 | 5.8 | 4.2 | 3.1 | 2.3 |
| Depreciation | ||||||||||
| Changes in Account Receivables | ||||||||||
| Changes in Inventories | ||||||||||
| Changes in Accounts Payable | ||||||||||
| Capital Expenditure | ||||||||||
| UFCF | -2.0 | 25.9 | -19.2 | -1.0 | 12.7 | 4.0 | 2.1 | 1.6 | 1.1 | .8 |
| WACC, % | 5.56 | 5.56 | 5.56 | 5.56 | 5.56 | 5.56 | 5.56 | 5.56 | 5.56 | 5.56 |
| PV UFCF | ||||||||||
| SUM PV UFCF | 8.6 | |||||||||
| Long Term Growth Rate, % | 2.00 | |||||||||
| Free cash flow (T + 1) | 1 | |||||||||
| Terminal Value | 24 | |||||||||
| Present Terminal Value | 18 | |||||||||
| Enterprise Value | 27 | |||||||||
| Net Debt | -25 | |||||||||
| Equity Value | 52 | |||||||||
| Diluted Shares Outstanding, MM | 17 | |||||||||
| Equity Value Per Share | 3.09 |
What You Will Get
- Real OCCI Financial Data: Pre-filled with OFS Credit Company, Inc.'s historical and projected data for precise analysis.
- Fully Editable Template: Modify key inputs like revenue growth, WACC, and EBITDA % with ease.
- Automatic Calculations: See OFS Credit Company, Inc.'s intrinsic value update instantly based on your changes.
- Professional Valuation Tool: Designed for investors, analysts, and consultants seeking accurate DCF results.
- User-Friendly Design: Simple structure and clear instructions for all experience levels.
Key Features
- Comprehensive Financial Data: OFS Credit Company, Inc.'s historical financial statements and pre-filled projections.
- Customizable Assumptions: Adjust WACC, tax rates, revenue growth, and EBITDA margins to fit your analysis.
- Real-Time Valuation: Instantly view OFS Credit Company, Inc.'s intrinsic value as you make changes.
- Insightful Visualizations: Interactive dashboard charts showcase valuation outcomes and essential metrics.
- Designed for Precision: A reliable tool tailored for analysts, investors, and finance professionals.
How It Works
- Step 1: Download the prebuilt Excel template containing OFS Credit Company, Inc. (OCCI) data.
- Step 2: Review the pre-filled sheets to familiarize yourself with the essential metrics.
- Step 3: Modify forecasts and assumptions in the editable yellow cells (WACC, growth rates, profit margins).
- Step 4: Instantly see the updated results, including the intrinsic value of OFS Credit Company, Inc. (OCCI).
- Step 5: Make well-informed investment decisions or create reports based on the generated outputs.
Why Choose This Calculator for OFS Credit Company, Inc. (OCCI)?
- Designed for Investors: A sophisticated tool tailored for investors, analysts, and financial advisors.
- Accurate Financial Data: OCCI’s historical and forecasted financials integrated for precise analysis.
- Dynamic Scenario Analysis: Effortlessly test various investment scenarios and assumptions.
- Comprehensive Outputs: Automatically calculates intrinsic value, NPV, and essential financial metrics.
- User-Friendly Interface: Detailed instructions guide you step-by-step through the calculation process.
Who Should Use This Product?
- Institutional Investors: Develop comprehensive valuation models for assessing OCCI's performance.
- Corporate Finance Teams: Evaluate financial scenarios to inform strategic decisions regarding OCCI.
- Financial Consultants: Deliver precise valuation analyses to clients interested in OCCI.
- Students and Instructors: Utilize actual market data to enhance learning in financial modeling with OCCI.
- Market Analysts: Gain insights into how companies like OFS Credit Company, Inc. (OCCI) are valued in the financial landscape.
What the Template Contains
- Pre-Filled DCF Model: OFS Credit Company's financial data preloaded for immediate use.
- WACC Calculator: Detailed calculations for Weighted Average Cost of Capital.
- Financial Ratios: Evaluate OFS Credit Company's profitability, leverage, and efficiency.
- Editable Inputs: Change assumptions such as growth, margins, and CAPEX to fit your scenarios.
- Financial Statements: Annual and quarterly reports to support detailed analysis.
- Interactive Dashboard: Easily visualize key valuation metrics and results.
Disclaimer
All information, articles, and product details provided on this website are for general informational and educational purposes only. We do not claim any ownership over, nor do we intend to infringe upon, any trademarks, copyrights, logos, brand names, or other intellectual property mentioned or depicted on this site. Such intellectual property remains the property of its respective owners, and any references here are made solely for identification or informational purposes, without implying any affiliation, endorsement, or partnership.
We make no representations or warranties, express or implied, regarding the accuracy, completeness, or suitability of any content or products presented. Nothing on this website should be construed as legal, tax, investment, financial, medical, or other professional advice. In addition, no part of this site—including articles or product references—constitutes a solicitation, recommendation, endorsement, advertisement, or offer to buy or sell any securities, franchises, or other financial instruments, particularly in jurisdictions where such activity would be unlawful.
All content is of a general nature and may not address the specific circumstances of any individual or entity. It is not a substitute for professional advice or services. Any actions you take based on the information provided here are strictly at your own risk. You accept full responsibility for any decisions or outcomes arising from your use of this website and agree to release us from any liability in connection with your use of, or reliance upon, the content or products found herein.