
|
Orange S.A. (ORA.PA) DCF -Bewertung |
Fully Editable: Tailor To Your Needs In Excel Or Sheets
Professional Design: Trusted, Industry-Standard Templates
Investor-Approved Valuation Models
MAC/PC Compatible, Fully Unlocked
No Expertise Is Needed; Easy To Follow
Orange S.A. (ORA.PA) Bundle
Möchten Sie den inneren Wert von Orange S.A. beurteilen? Unser (ORAPA) DCF-Taschenrechner integriert reale Daten mit umfangreichen Anpassungsfunktionen, sodass Sie Prognosen anpassen und Ihre Anlagestrategien verbessern können.
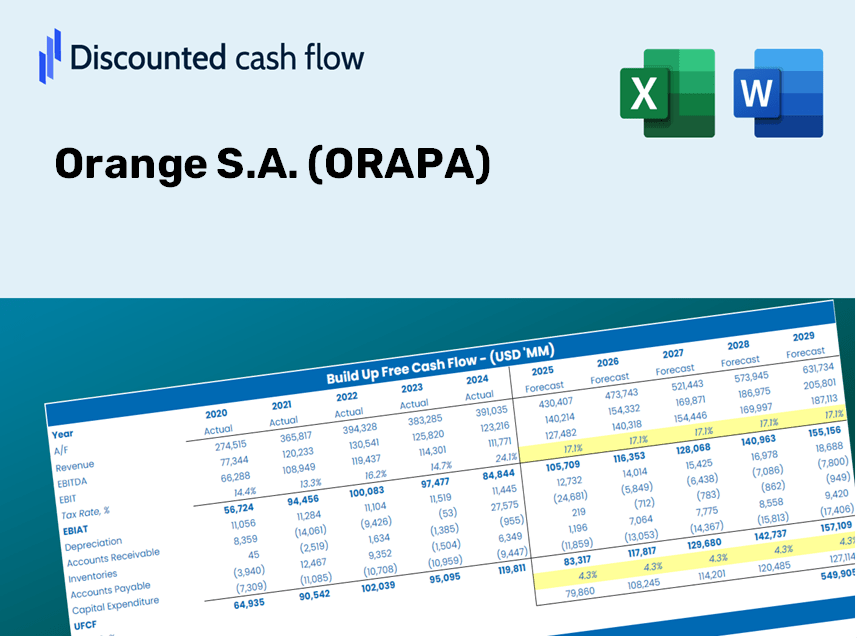
Discounted Cash Flow (DCF) - (USD MM)
| Year | AY1 2020 |
AY2 2021 |
AY3 2022 |
AY4 2023 |
AY5 2024 |
FY1 2025 |
FY2 2026 |
FY3 2027 |
FY4 2028 |
FY5 2029 |
|---|---|---|---|---|---|---|---|---|---|---|
| Revenue | 42,270.0 | 42,522.0 | 43,471.0 | 44,122.0 | 40,260.0 | 40,635.1 | 41,013.8 | 41,395.9 | 41,781.7 | 42,171.0 |
| Revenue Growth, % | 0 | 0.59617 | 2.23 | 1.5 | -8.75 | 0.9318 | 0.9318 | 0.9318 | 0.9318 | 0.9318 |
| EBITDA | 12,888.0 | 11,644.0 | 12,984.0 | 13,124.0 | 12,955.0 | 12,163.3 | 12,276.6 | 12,391.0 | 12,506.5 | 12,623.0 |
| EBITDA, % | 30.49 | 27.38 | 29.87 | 29.74 | 32.18 | 29.93 | 29.93 | 29.93 | 29.93 | 29.93 |
| Depreciation | 7,189.0 | 7,158.0 | 7,142.0 | 7,441.0 | 6,679.0 | 6,804.3 | 6,867.7 | 6,931.7 | 6,996.3 | 7,061.5 |
| Depreciation, % | 17.01 | 16.83 | 16.43 | 16.86 | 16.59 | 16.74 | 16.74 | 16.74 | 16.74 | 16.74 |
| EBIT | 5,699.0 | 4,486.0 | 5,842.0 | 5,683.0 | 6,276.0 | 5,359.0 | 5,408.9 | 5,459.3 | 5,510.2 | 5,561.5 |
| EBIT, % | 13.48 | 10.55 | 13.44 | 12.88 | 15.59 | 13.19 | 13.19 | 13.19 | 13.19 | 13.19 |
| Total Cash | 11,351.0 | 10,887.0 | 10,504.0 | 8,319.0 | 12,211.0 | 10,224.2 | 10,319.5 | 10,415.6 | 10,512.7 | 10,610.6 |
| Total Cash, percent | .0 | .0 | .0 | .0 | .0 | .0 | .0 | .0 | .0 | .0 |
| Account Receivables | 7,903.0 | 8,620.0 | 9,034.0 | 12,478.0 | 7,521.0 | 8,672.5 | 8,753.3 | 8,834.9 | 8,917.2 | 9,000.3 |
| Account Receivables, % | 18.7 | 20.27 | 20.78 | 28.28 | 18.68 | 21.34 | 21.34 | 21.34 | 21.34 | 21.34 |
| Inventories | 814.0 | 952.0 | 1,048.0 | 1,152.0 | 791.0 | 906.2 | 914.7 | 923.2 | 931.8 | 940.5 |
| Inventories, % | 1.93 | 2.24 | 2.41 | 2.61 | 1.96 | 2.23 | 2.23 | 2.23 | 2.23 | 2.23 |
| Accounts Payable | 6,475.0 | 6,738.0 | 7,067.0 | 7,042.0 | 6,448.0 | 6,452.6 | 6,512.8 | 6,573.4 | 6,634.7 | 6,696.5 |
| Accounts Payable, % | 15.32 | 15.85 | 16.26 | 15.96 | 16.02 | 15.88 | 15.88 | 15.88 | 15.88 | 15.88 |
| Capital Expenditure | -8,546.0 | -8,749.0 | -8,777.0 | -7,829.0 | -6,710.0 | -7,752.7 | -7,824.9 | -7,897.8 | -7,971.4 | -8,045.7 |
| Capital Expenditure, % | -20.22 | -20.58 | -20.19 | -17.74 | -16.67 | -19.08 | -19.08 | -19.08 | -19.08 | -19.08 |
| Tax Rate, % | 41.98 | 41.98 | 41.98 | 41.98 | 41.98 | 41.98 | 41.98 | 41.98 | 41.98 | 41.98 |
| EBITAT | 6,532.1 | 600.7 | 3,229.5 | 3,685.9 | 3,641.6 | 3,124.9 | 3,154.0 | 3,183.4 | 3,213.0 | 3,243.0 |
| Depreciation | ||||||||||
| Changes in Account Receivables | ||||||||||
| Changes in Inventories | ||||||||||
| Changes in Accounts Payable | ||||||||||
| Capital Expenditure | ||||||||||
| UFCF | 2,933.1 | -1,582.3 | 1,413.5 | -275.1 | 8,334.6 | 914.4 | 2,167.6 | 2,187.8 | 2,208.2 | 2,228.8 |
| WACC, % | 4.15 | 2.42 | 3.26 | 3.45 | 3.31 | 3.32 | 3.32 | 3.32 | 3.32 | 3.32 |
| PV UFCF | ||||||||||
| SUM PV UFCF | 8,730.9 | |||||||||
| Long Term Growth Rate, % | 1.00 | |||||||||
| Free cash flow (T + 1) | 2,251 | |||||||||
| Terminal Value | 97,167 | |||||||||
| Present Terminal Value | 82,540 | |||||||||
| Enterprise Value | 91,271 | |||||||||
| Net Debt | 33,900 | |||||||||
| Equity Value | 57,371 | |||||||||
| Diluted Shares Outstanding, MM | 2,660 | |||||||||
| Equity Value Per Share | 21.57 |
What You Will Receive
- Genuine Orange Data: Preloaded financial metrics – ranging from revenue to EBIT – based on actual and projected statistics.
- Complete Customization: Modify all essential parameters (yellow cells) including WACC, growth %, and tax rates.
- Instant Valuation Adjustments: Automated recalculations to assess the effects of changes on Orange S.A.’s (ORAPA) fair value.
- Flexible Excel Template: Designed for quick modifications, scenario analyses, and comprehensive forecasts.
- Efficient and Precise: Eliminate the need to build models from the ground up while ensuring accuracy and adaptability.
Key Features
- 🔍 Real-Life ORAPA Financials: Pre-loaded historical and projected data for Orange S.A.
- ✏️ Fully Customizable Inputs: Modify all essential parameters (yellow cells) such as WACC, growth %, and tax rates.
- 📊 Professional DCF Valuation: Integrated formulas compute the intrinsic value of Orange S.A. using the Discounted Cash Flow method.
- ⚡ Instant Results: View Orange S.A.'s valuation immediately after making adjustments.
- Scenario Analysis: Evaluate and compare results for different financial assumptions side-by-side.
How It Functions
- Step 1: Download the prebuilt Excel template featuring Orange S.A. (ORAPA) data.
- Step 2: Navigate through the pre-filled sheets to familiarize yourself with the essential metrics.
- Step 3: Modify forecasts and assumptions in the editable yellow cells (WACC, growth, margins).
- Step 4: Instantly see the recalibrated results, including Orange S.A.'s intrinsic value.
- Step 5: Make knowledgeable investment decisions or create reports based on the generated outputs.
Why Opt for This Calculator?
- Designed for Experts: A sophisticated tool favored by analysts, CFOs, and consultants.
- Current Financial Data: Orange S.A.'s historical and forecasted financials are preloaded for precision.
- Comprehensive Scenario Analysis: Effortlessly simulate various forecasts and assumptions.
- Intuitive Outputs: Automatically computes intrinsic value, NPV, and essential metrics.
- User-Friendly: Step-by-step guidance leads you through the calculations.
Who Should Utilize This Product?
- Investors: Assess Orange S.A.'s (ORAPA) valuation prior to buying or selling shares.
- CFOs and Financial Analysts: Optimize valuation workflows and validate financial forecasts.
- Startup Founders: Understand the valuation methods of leading public companies like Orange S.A.
- Consultants: Provide comprehensive valuation reports for clientele.
- Students and Educators: Apply real-world data to hone and teach valuation strategies.
Contents of the Template
- Pre-Filled Data: Contains historical financial information and forecasts for Orange S.A. (ORAPA).
- Discounted Cash Flow Model: An editable DCF valuation model featuring automatic calculations.
- Weighted Average Cost of Capital (WACC): A specialized sheet for WACC calculations using custom inputs.
- Key Financial Ratios: Assess Orange S.A.'s profitability, efficiency, and financial leverage.
- Customizable Inputs: Easily modify revenue growth, margins, and tax rates.
- Clear Dashboard: Visual representations including charts and tables that summarize critical valuation outcomes.
Disclaimer
All information, articles, and product details provided on this website are for general informational and educational purposes only. We do not claim any ownership over, nor do we intend to infringe upon, any trademarks, copyrights, logos, brand names, or other intellectual property mentioned or depicted on this site. Such intellectual property remains the property of its respective owners, and any references here are made solely for identification or informational purposes, without implying any affiliation, endorsement, or partnership.
We make no representations or warranties, express or implied, regarding the accuracy, completeness, or suitability of any content or products presented. Nothing on this website should be construed as legal, tax, investment, financial, medical, or other professional advice. In addition, no part of this site—including articles or product references—constitutes a solicitation, recommendation, endorsement, advertisement, or offer to buy or sell any securities, franchises, or other financial instruments, particularly in jurisdictions where such activity would be unlawful.
All content is of a general nature and may not address the specific circumstances of any individual or entity. It is not a substitute for professional advice or services. Any actions you take based on the information provided here are strictly at your own risk. You accept full responsibility for any decisions or outcomes arising from your use of this website and agree to release us from any liability in connection with your use of, or reliance upon, the content or products found herein.