
|
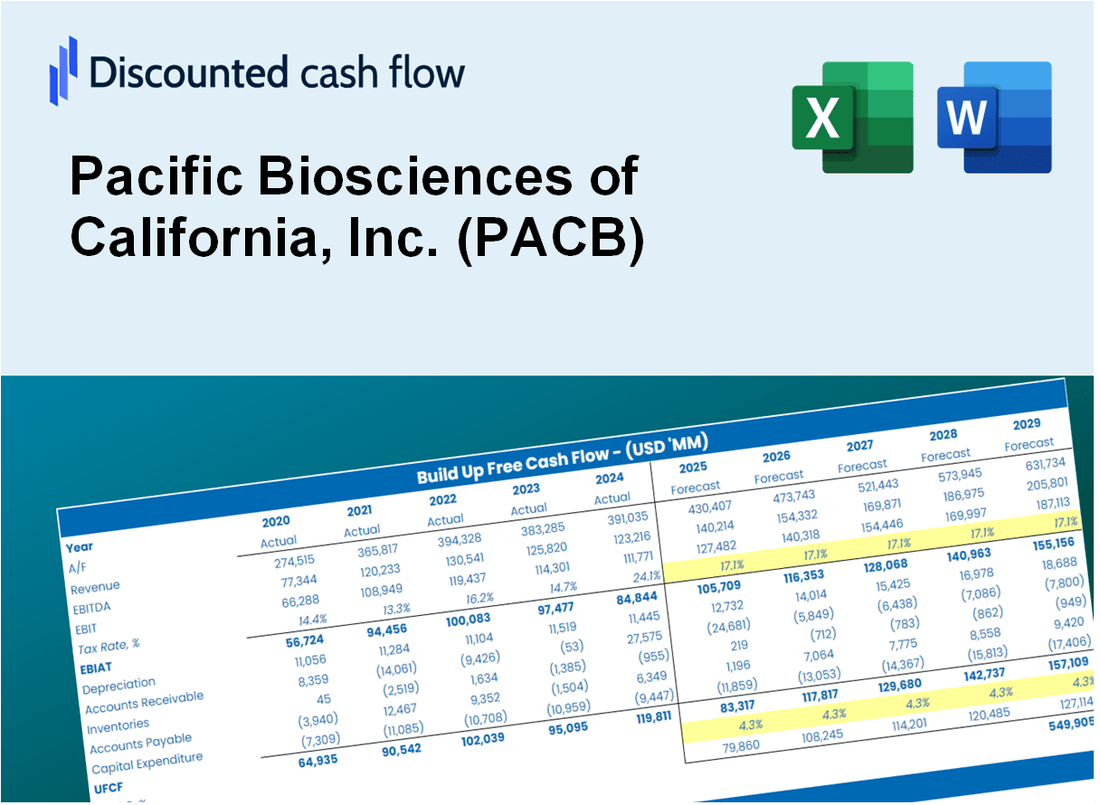
Pacific Biosciences of California, Inc. (PACB) DCF -Bewertung |
Fully Editable: Tailor To Your Needs In Excel Or Sheets
Professional Design: Trusted, Industry-Standard Templates
Investor-Approved Valuation Models
MAC/PC Compatible, Fully Unlocked
No Expertise Is Needed; Easy To Follow
Pacific Biosciences of California, Inc. (PACB) Bundle
Sparen Sie Zeit und verbessern Sie die Präzision mit unserem (PACB) DCF -Taschenrechner! In diesem Tool können Sie mit echten Daten von Pacific Biosciences of California, Inc. und anpassbaren Annahmen genau wie ein erfahrener Investor prognostizieren, analysieren und value (PACB) prognostizieren, analysieren und Wert).
What You Will Get
- Real PACB Financials: Access to historical and projected data for precise valuation.
- Customizable Inputs: Adjust WACC, tax rates, revenue growth, and capital expenditures to fit your analysis.
- Dynamic Calculations: Intrinsic value and NPV are computed in real-time.
- Scenario Analysis: Evaluate various scenarios to assess the future performance of Pacific Biosciences.
- User-Friendly Design: Designed for professionals while remaining approachable for newcomers.
Key Features
- Comprehensive PACB Data: Pre-filled with Pacific Biosciences' historical financials and future projections.
- Fully Customizable Inputs: Modify revenue growth rates, profit margins, WACC, tax rates, and capital expenditures.
- Dynamic Valuation Model: Instant updates to Net Present Value (NPV) and intrinsic value based on your adjustments.
- Scenario Testing: Develop multiple forecasting scenarios to explore various valuation results.
- User-Friendly Interface: Intuitive design that caters to both professionals and novices.
How It Works
- Download the Template: Gain immediate access to the Excel-based PACB DCF Calculator.
- Input Your Assumptions: Modify the yellow-highlighted cells for growth rates, WACC, margins, and more.
- Instant Calculations: The model automatically recalculates the intrinsic value of Pacific Biosciences.
- Test Scenarios: Experiment with different assumptions to assess potential valuation variations.
- Analyze and Decide: Leverage the results to inform your investment or financial strategy.
Why Choose This Calculator for Pacific Biosciences (PACB)?
- Accuracy: Utilizes real Pacific Biosciences financial data for precise calculations.
- Flexibility: Allows users to easily adjust and test various input parameters.
- Time-Saving: Eliminate the need to construct a DCF model from the ground up.
- Professional-Grade: Crafted with the precision and usability expected by financial executives.
- User-Friendly: Designed for ease of use, suitable for users with varying levels of financial expertise.
Who Should Use This Product?
- Investors: Assess Pacific Biosciences’ valuation before making stock transactions.
- CFOs and Financial Analysts: Optimize valuation methodologies and evaluate forecasts.
- Startup Founders: Understand the valuation processes of leading biotech firms like Pacific Biosciences.
- Consultants: Provide expert valuation analyses and reports for clients in the biotech sector.
- Students and Educators: Utilize current data to learn and teach valuation strategies in a real-world context.
What the Template Contains
- Comprehensive DCF Model: Editable template with detailed valuation calculations tailored for Pacific Biosciences of California, Inc. (PACB).
- Real-World Data: Pacific Biosciences’ historical and projected financials preloaded for thorough analysis.
- Customizable Parameters: Adjust WACC, growth rates, and tax assumptions to explore various scenarios.
- Financial Statements: Complete annual and quarterly breakdowns for enhanced insights into performance.
- Key Ratios: Integrated analysis for profitability, efficiency, and leverage metrics.
- Dashboard with Visual Outputs: Charts and tables designed for clear, actionable results specific to Pacific Biosciences of California, Inc. (PACB).
Disclaimer
All information, articles, and product details provided on this website are for general informational and educational purposes only. We do not claim any ownership over, nor do we intend to infringe upon, any trademarks, copyrights, logos, brand names, or other intellectual property mentioned or depicted on this site. Such intellectual property remains the property of its respective owners, and any references here are made solely for identification or informational purposes, without implying any affiliation, endorsement, or partnership.
We make no representations or warranties, express or implied, regarding the accuracy, completeness, or suitability of any content or products presented. Nothing on this website should be construed as legal, tax, investment, financial, medical, or other professional advice. In addition, no part of this site—including articles or product references—constitutes a solicitation, recommendation, endorsement, advertisement, or offer to buy or sell any securities, franchises, or other financial instruments, particularly in jurisdictions where such activity would be unlawful.
All content is of a general nature and may not address the specific circumstances of any individual or entity. It is not a substitute for professional advice or services. Any actions you take based on the information provided here are strictly at your own risk. You accept full responsibility for any decisions or outcomes arising from your use of this website and agree to release us from any liability in connection with your use of, or reliance upon, the content or products found herein.