
|
Persistente Systeme begrenzt (persistent.ns) DCF -Bewertung |
Fully Editable: Tailor To Your Needs In Excel Or Sheets
Professional Design: Trusted, Industry-Standard Templates
Investor-Approved Valuation Models
MAC/PC Compatible, Fully Unlocked
No Expertise Is Needed; Easy To Follow
Persistent Systems Limited (PERSISTENT.NS) Bundle
Verbessern Sie Ihre Anlagestrategien mit dem DCF -Taschenrechner von Persistent Systems Limited (Persistentns)! Erforschen Sie authentische Finanzdaten, passen Sie Wachstumsprojektionen und -kosten an und beobachten Sie, wie sich diese Modifikationen in Echtzeit auf den inneren Wert von persistenten Systemen (Persistentns) auswirken.
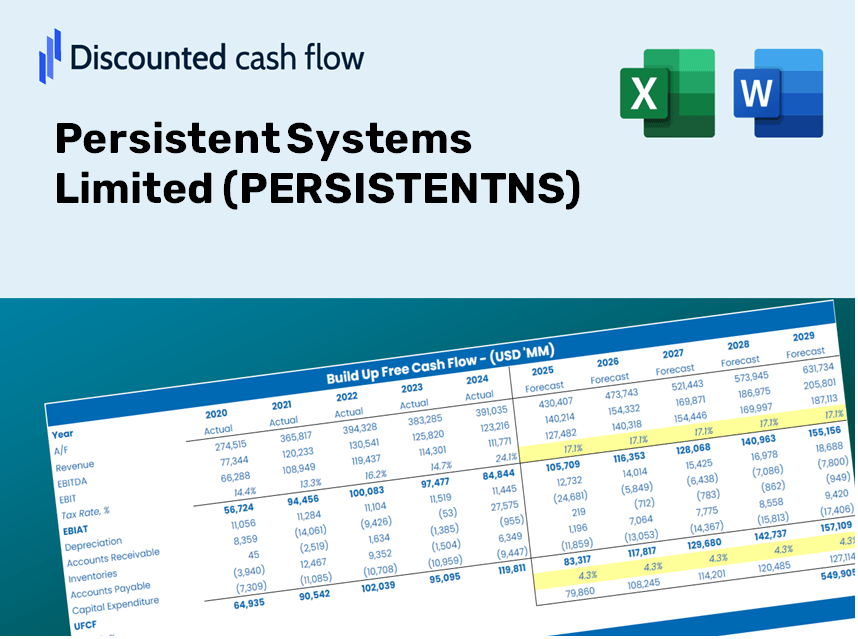
Discounted Cash Flow (DCF) - (USD MM)
| Year | AY1 2021 |
AY2 2022 |
AY3 2023 |
AY4 2024 |
AY5 2025 |
FY1 2026 |
FY2 2027 |
FY3 2028 |
FY4 2029 |
FY5 2030 |
|---|---|---|---|---|---|---|---|---|---|---|
| Revenue | 41,878.9 | 57,107.5 | 83,505.9 | 90,951.1 | 119,387.2 | 156,030.2 | 203,919.8 | 266,508.1 | 348,306.3 | 455,210.5 |
| Revenue Growth, % | 0 | 36.36 | 46.23 | 8.92 | 31.27 | 30.69 | 30.69 | 30.69 | 30.69 | 30.69 |
| EBITDA | 7,907.9 | 11,021.3 | 15,600.9 | 16,625.9 | 19,271.9 | 28,486.9 | 37,230.3 | 48,657.2 | 63,591.4 | 83,109.2 |
| EBITDA, % | 18.88 | 19.3 | 18.68 | 18.28 | 16.14 | 18.26 | 18.26 | 18.26 | 18.26 | 18.26 |
| Depreciation | 1,755.5 | 1,660.1 | 2,719.0 | 2,617.2 | 2,188.6 | 4,701.4 | 6,144.4 | 8,030.2 | 10,494.9 | 13,716.1 |
| Depreciation, % | 4.19 | 2.91 | 3.26 | 2.88 | 1.83 | 3.01 | 3.01 | 3.01 | 3.01 | 3.01 |
| EBIT | 6,152.4 | 9,361.1 | 12,881.9 | 14,008.7 | 17,083.3 | 23,785.5 | 31,085.9 | 40,627.0 | 53,096.5 | 69,393.2 |
| EBIT, % | 14.69 | 16.39 | 15.43 | 15.4 | 14.31 | 15.24 | 15.24 | 15.24 | 15.24 | 15.24 |
| Total Cash | 15,072.1 | 12,663.9 | 9,562.4 | 10,479.9 | 11,152.2 | 28,235.3 | 36,901.4 | 48,227.4 | 63,029.7 | 82,375.1 |
| Total Cash, percent | .0 | .0 | .0 | .0 | .0 | .0 | .0 | .0 | .0 | .0 |
| Account Receivables | 9,365.3 | 13,657.7 | 21,139.1 | 24,962.7 | 28,992.4 | 38,484.5 | 50,296.3 | 65,733.6 | 85,908.9 | 112,276.5 |
| Account Receivables, % | 22.36 | 23.92 | 25.31 | 27.45 | 24.28 | 24.66 | 24.66 | 24.66 | 24.66 | 24.66 |
| Inventories | 851.0 | 60.6 | .0 | 58.0 | .0 | 687.1 | 898.0 | 1,173.6 | 1,533.8 | 2,004.6 |
| Inventories, % | 2.03 | 0.10605 | 0 | 0.06371556 | 0 | 0.44036 | 0.44036 | 0.44036 | 0.44036 | 0.44036 |
| Accounts Payable | 2,733.4 | 4,298.7 | 5,689.1 | 8,138.6 | 8,886.2 | 11,627.0 | 15,195.6 | 19,859.5 | 25,954.9 | 33,921.1 |
| Accounts Payable, % | 6.53 | 7.53 | 6.81 | 8.95 | 7.44 | 7.45 | 7.45 | 7.45 | 7.45 | 7.45 |
| Capital Expenditure | -1,281.0 | -3,854.0 | -4,333.0 | -2,839.2 | -2,366.9 | -6,272.6 | -8,197.8 | -10,713.9 | -14,002.3 | -18,300.0 |
| Capital Expenditure, % | -3.06 | -6.75 | -5.19 | -3.12 | -1.98 | -4.02 | -4.02 | -4.02 | -4.02 | -4.02 |
| Tax Rate, % | 23.17 | 23.17 | 23.17 | 23.17 | 23.17 | 23.17 | 23.17 | 23.17 | 23.17 | 23.17 |
| EBITAT | 4,549.6 | 6,992.3 | 9,562.3 | 10,581.8 | 13,125.9 | 17,850.9 | 23,329.8 | 30,490.3 | 39,848.5 | 52,079.1 |
| Depreciation | ||||||||||
| Changes in Account Receivables | ||||||||||
| Changes in Inventories | ||||||||||
| Changes in Accounts Payable | ||||||||||
| Capital Expenditure | ||||||||||
| UFCF | -2,458.8 | 2,861.7 | 1,917.8 | 8,928.0 | 9,723.3 | 8,841.4 | 12,822.2 | 16,757.7 | 21,901.0 | 28,623.0 |
| WACC, % | 5.42 | 5.42 | 5.42 | 5.42 | 5.42 | 5.42 | 5.42 | 5.42 | 5.42 | 5.42 |
| PV UFCF | ||||||||||
| SUM PV UFCF | 73,939.2 | |||||||||
| Long Term Growth Rate, % | 4.00 | |||||||||
| Free cash flow (T + 1) | 29,768 | |||||||||
| Terminal Value | 2,093,253 | |||||||||
| Present Terminal Value | 1,607,547 | |||||||||
| Enterprise Value | 1,681,486 | |||||||||
| Net Debt | -3,635 | |||||||||
| Equity Value | 1,685,121 | |||||||||
| Diluted Shares Outstanding, MM | 155 | |||||||||
| Equity Value Per Share | 10,860.54 |
What You Will Receive
- Genuine Persistent Systems Data: Preloaded financial metrics – from revenue to EBIT – utilizing real and anticipated figures.
- Complete Customization: Modify all essential parameters (yellow cells) such as WACC, growth %, and tax rates.
- Instant Valuation Refresh: Automatic recalculations to assess the impact of adjustments on Persistent Systems’ fair value.
- Flexible Excel Template: Designed for quick alterations, scenario analyses, and comprehensive projections.
- Efficient and Precise: Eliminate the need to build models from the ground up while ensuring accuracy and adaptability.
Key Features
- Advanced DCF Calculator: Offers comprehensive unlevered and levered DCF valuation models tailored for Persistent Systems Limited (PERSISTENTNS).
- WACC Calculator: Ready-to-use Weighted Average Cost of Capital sheet with adjustable inputs specific to PERSISTENTNS.
- Customizable Forecast Assumptions: Adjust growth rates, capital expenditures, and discount rates to fit your analysis for PERSISTENTNS.
- Integrated Financial Ratios: Evaluate profitability, leverage, and efficiency ratios relevant to Persistent Systems Limited (PERSISTENTNS).
- Dashboard and Visualizations: Graphical representations that highlight essential valuation metrics for straightforward analysis of PERSISTENTNS.
How It Works
- Step 1: Download the pre-built Excel template featuring Persistent Systems Limited’s data.
- Step 2: Navigate through the pre-filled sheets to familiarize yourself with the essential metrics.
- Step 3: Adjust forecasts and assumptions in the editable yellow cells (WACC, growth, margins).
- Step 4: Instantly see the updated results, including Persistent Systems Limited’s intrinsic value.
- Step 5: Utilize the outputs to make informed investment choices or generate detailed reports.
Why Opt for This Calculator?
- All-in-One Solution: Features DCF, WACC, and financial ratio assessments in a single tool.
- Flexible Inputs: Modify the yellow-highlighted fields to explore different scenarios.
- In-Depth Analysis: Automatically determines the intrinsic value and Net Present Value for Persistent Systems Limited (PERSISTENTNS).
- Preloaded Information: Historical and projected data provide reliable starting points for analysis.
- High-Quality Standards: Perfect for financial analysts, investors, and business consultants alike.
Who Can Benefit from Persistent Systems Limited (PERSISTENTNS)?
- Investors: Leverage our advanced insights to make informed investment decisions in the tech sector.
- Financial Analysts: Utilize our detailed data analytics to streamline your forecasting and analysis processes.
- Consultants: Easily tailor our comprehensive reports for client presentations and strategic recommendations.
- Tech Enthusiasts: Enhance your knowledge of digital transformation and innovative solutions through our case studies.
- Educators and Students: Incorporate our resources as a practical tool for courses focusing on technology and business strategy.
Contents of the Template
- Pre-Filled Data: Features Persistent Systems Limited's historical financial performance and projections.
- Discounted Cash Flow Model: An adjustable DCF valuation model with automated calculations.
- Weighted Average Cost of Capital (WACC): A specific sheet for computing WACC using tailored inputs.
- Key Financial Ratios: Assess Persistent Systems Limited's (PERSISTENTNS) profitability, efficiency, and leverage metrics.
- Customizable Inputs: Easily modify revenue growth, profit margins, and tax rates.
- User-Friendly Dashboard: Visuals and tables that provide a summary of key valuation outcomes.
Disclaimer
All information, articles, and product details provided on this website are for general informational and educational purposes only. We do not claim any ownership over, nor do we intend to infringe upon, any trademarks, copyrights, logos, brand names, or other intellectual property mentioned or depicted on this site. Such intellectual property remains the property of its respective owners, and any references here are made solely for identification or informational purposes, without implying any affiliation, endorsement, or partnership.
We make no representations or warranties, express or implied, regarding the accuracy, completeness, or suitability of any content or products presented. Nothing on this website should be construed as legal, tax, investment, financial, medical, or other professional advice. In addition, no part of this site—including articles or product references—constitutes a solicitation, recommendation, endorsement, advertisement, or offer to buy or sell any securities, franchises, or other financial instruments, particularly in jurisdictions where such activity would be unlawful.
All content is of a general nature and may not address the specific circumstances of any individual or entity. It is not a substitute for professional advice or services. Any actions you take based on the information provided here are strictly at your own risk. You accept full responsibility for any decisions or outcomes arising from your use of this website and agree to release us from any liability in connection with your use of, or reliance upon, the content or products found herein.