
|
Planet Fitness, Inc. (PLNT) DCF -Bewertung |
Fully Editable: Tailor To Your Needs In Excel Or Sheets
Professional Design: Trusted, Industry-Standard Templates
Investor-Approved Valuation Models
MAC/PC Compatible, Fully Unlocked
No Expertise Is Needed; Easy To Follow
Planet Fitness, Inc. (PLNT) Bundle
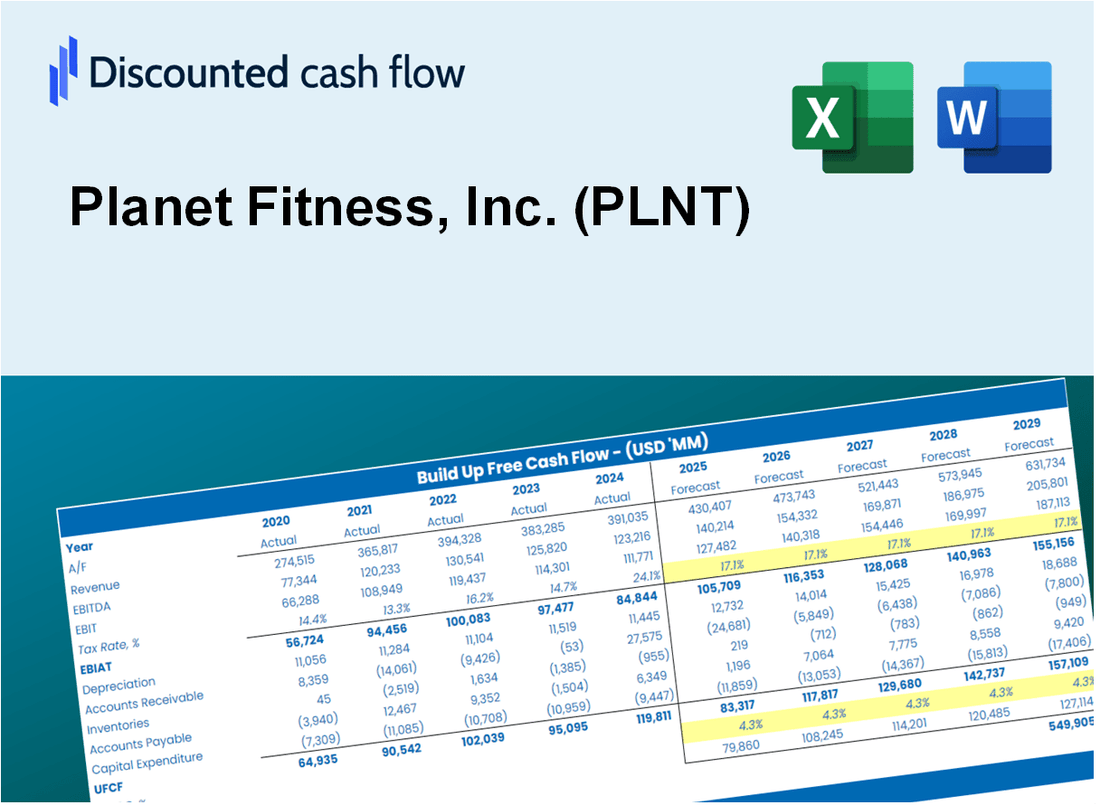
Gewinnen Sie mit unserem DCF-Taschenrechner für Ihre Planet Fitness, Inc. (PLNT) Bewertungsanalyse (PLNT)! Diese Excel -Vorlage, die mit realen PLNT -Daten vorinstalliert ist, ermöglicht es Ihnen, Prognosen und Annahmen anzupassen, sodass Sie den intrinsischen Wert von Planet Fitness, Inc. (PLNT) mit Genauigkeit berechnen können.
What You Will Get
- Editable Forecast Inputs: Easily modify assumptions (growth %, margins, WACC) to explore various scenarios.
- Real-World Data: Planet Fitness's financial data pre-filled to expedite your analysis.
- Automatic DCF Outputs: The template computes Net Present Value (NPV) and intrinsic value for you.
- Customizable and Professional: A refined Excel model that adjusts to your valuation requirements.
- Built for Analysts and Investors: Perfect for evaluating projections, confirming strategies, and enhancing efficiency.
Key Features
- Comprehensive Data: Planet Fitness's historical financial records and pre-populated forecasts.
- Customizable Inputs: Adjust WACC, tax rates, revenue growth, and EBITDA margins as needed.
- Real-Time Insights: Monitor Planet Fitness's intrinsic value update instantly.
- Visual Data Representation: Dashboard graphs illustrate valuation outcomes and essential metrics.
- Designed for Precision: A reliable tool for analysts, investors, and finance professionals.
How It Works
- 1. Download the Template: Get the Excel file featuring Planet Fitness, Inc.'s (PLNT) financial data.
- 2. Modify Assumptions: Adjust critical inputs such as membership growth rates, operating expenses, and capital investments.
- 3. Analyze Results in Real-Time: The DCF model automatically computes the intrinsic value and NPV based on your inputs.
- 4. Explore Scenarios: Evaluate various projections to understand different valuation possibilities.
- 5. Present with Assurance: Deliver expert valuation analysis to inform your strategic decisions.
Why Choose This Calculator for Planet Fitness, Inc. (PLNT)?
- All-in-One Solution: Combines DCF, WACC, and financial ratio analyses tailored for the fitness industry.
- Flexible Inputs: Modify the yellow-highlighted cells to explore different financial scenarios.
- In-Depth Analysis: Automatically computes Planet Fitness’s intrinsic value and Net Present Value.
- Integrated Data: Access historical and projected data for precise calculations.
- High-Quality Standards: Perfect for financial analysts, investors, and fitness industry consultants.
Who Should Use This Product?
- Individual Investors: Make informed decisions about buying or selling Planet Fitness stock (PLNT).
- Financial Analysts: Streamline valuation processes with ready-to-use financial models for Planet Fitness (PLNT).
- Consultants: Deliver professional valuation insights to clients quickly and accurately regarding Planet Fitness (PLNT).
- Business Owners: Understand how fitness franchises like Planet Fitness (PLNT) are valued to guide your own strategy.
- Finance Students: Learn valuation techniques using real-world data and scenarios focused on Planet Fitness (PLNT).
What the Template Contains
- Pre-Filled Data: Includes Planet Fitness, Inc.'s (PLNT) historical financials and forecasts.
- Discounted Cash Flow Model: Editable DCF valuation model with automatic calculations.
- Weighted Average Cost of Capital (WACC): A dedicated sheet for calculating WACC based on custom inputs.
- Key Financial Ratios: Analyze Planet Fitness, Inc.'s (PLNT) profitability, efficiency, and leverage.
- Customizable Inputs: Edit revenue growth, margins, and tax rates with ease.
- Clear Dashboard: Charts and tables summarizing key valuation results.
Disclaimer
All information, articles, and product details provided on this website are for general informational and educational purposes only. We do not claim any ownership over, nor do we intend to infringe upon, any trademarks, copyrights, logos, brand names, or other intellectual property mentioned or depicted on this site. Such intellectual property remains the property of its respective owners, and any references here are made solely for identification or informational purposes, without implying any affiliation, endorsement, or partnership.
We make no representations or warranties, express or implied, regarding the accuracy, completeness, or suitability of any content or products presented. Nothing on this website should be construed as legal, tax, investment, financial, medical, or other professional advice. In addition, no part of this site—including articles or product references—constitutes a solicitation, recommendation, endorsement, advertisement, or offer to buy or sell any securities, franchises, or other financial instruments, particularly in jurisdictions where such activity would be unlawful.
All content is of a general nature and may not address the specific circumstances of any individual or entity. It is not a substitute for professional advice or services. Any actions you take based on the information provided here are strictly at your own risk. You accept full responsibility for any decisions or outcomes arising from your use of this website and agree to release us from any liability in connection with your use of, or reliance upon, the content or products found herein.