
|
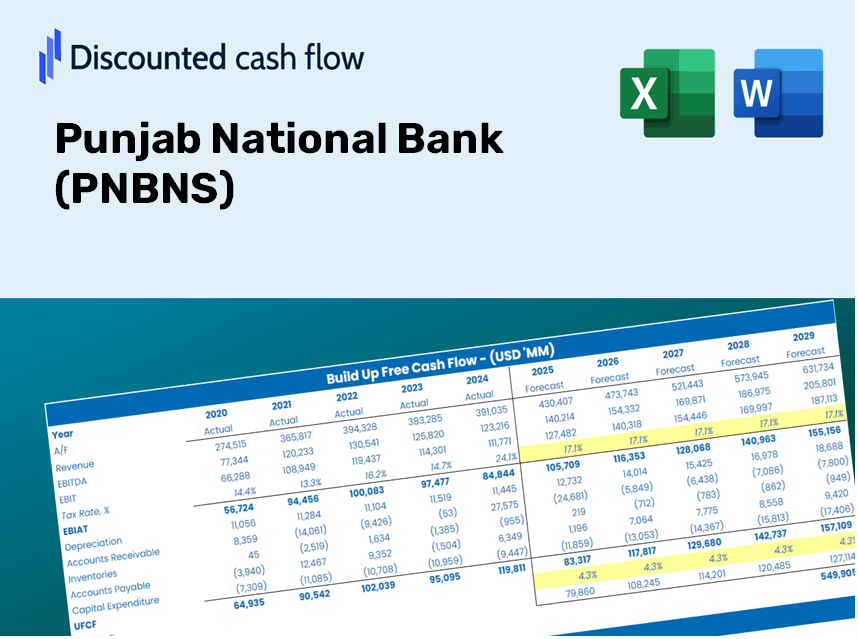
Punjab National Bank (PNB.NS) DCF -Bewertung |
Fully Editable: Tailor To Your Needs In Excel Or Sheets
Professional Design: Trusted, Industry-Standard Templates
Investor-Approved Valuation Models
MAC/PC Compatible, Fully Unlocked
No Expertise Is Needed; Easy To Follow
Punjab National Bank (PNB.NS) Bundle
Optimieren Sie Ihre Zeit und verbessern Sie die Präzision mit unserem (PNBNS) DCF -Taschenrechner! Mithilfe realer Daten von Punjab National Bank und anpassbaren Annahmen können Sie dieses Tool wie ein erfahrener Investor prognostizieren, analysieren und value (PNBNs) prognostizieren.
Discounted Cash Flow (DCF) - (USD MM)
| Year | AY1 2021 |
AY2 2022 |
AY3 2023 |
AY4 2024 |
AY5 2025 |
FY1 2026 |
FY2 2027 |
FY3 2028 |
FY4 2029 |
FY5 2030 |
|---|---|---|---|---|---|---|---|---|---|---|
| Revenue | 944,043.8 | 879,765.9 | 989,090.9 | 421,406.9 | 586,030.0 | 567,406.6 | 549,375.0 | 531,916.4 | 515,012.6 | 498,646.1 |
| Revenue Growth, % | 0 | -6.81 | 12.43 | -57.39 | 39.07 | -3.18 | -3.18 | -3.18 | -3.18 | -3.18 |
| EBITDA | 37,951.0 | 54,906.3 | 60,557.5 | 142,373.1 | 270,100.5 | 109,235.6 | 105,764.2 | 102,403.1 | 99,148.9 | 95,998.0 |
| EBITDA, % | 4.02 | 6.24 | 6.12 | 33.79 | 46.09 | 19.25 | 19.25 | 19.25 | 19.25 | 19.25 |
| Depreciation | .0 | 8,961.7 | 9,048.7 | 9,056.0 | 9,575.1 | 6,487.0 | 6,280.9 | 6,081.3 | 5,888.0 | 5,700.9 |
| Depreciation, % | 0 | 1.02 | 0.91485 | 2.15 | 1.63 | 1.14 | 1.14 | 1.14 | 1.14 | 1.14 |
| EBIT | 37,951.0 | 45,944.6 | 51,508.8 | 133,317.1 | 260,525.4 | 102,748.6 | 99,483.3 | 96,321.8 | 93,260.8 | 90,297.1 |
| EBIT, % | 4.02 | 5.22 | 5.21 | 31.64 | 44.46 | 18.11 | 18.11 | 18.11 | 18.11 | 18.11 |
| Total Cash | 1,133,344.3 | 1,341,938.8 | 1,573,284.8 | 1,314,001.9 | 1,507,595.8 | 567,406.6 | 549,375.0 | 531,916.4 | 515,012.6 | 498,646.1 |
| Total Cash, percent | .0 | .0 | .0 | .0 | .0 | .0 | .0 | .0 | .0 | .0 |
| Account Receivables | 88,704.9 | 95,389.0 | 126,874.9 | 176,605.5 | 249,693.4 | 133,434.0 | 129,193.7 | 125,088.0 | 121,112.8 | 117,264.0 |
| Account Receivables, % | 9.4 | 10.84 | 12.83 | 41.91 | 42.61 | 23.52 | 23.52 | 23.52 | 23.52 | 23.52 |
| Inventories | .0 | -1,424,237.3 | -1,664,357.0 | -1,490,607.4 | .0 | -340,443.9 | -329,625.0 | -319,149.8 | -309,007.6 | -299,187.6 |
| Inventories, % | 0 | -161.89 | -168.27 | -353.72 | 0 | -60 | -60 | -60 | -60 | -60 |
| Accounts Payable | 27,339.0 | 27,826.6 | 34,511.4 | 42,813.1 | 47,402.4 | 31,543.7 | 30,541.3 | 29,570.7 | 28,631.0 | 27,721.1 |
| Accounts Payable, % | 2.9 | 3.16 | 3.49 | 10.16 | 8.09 | 5.56 | 5.56 | 5.56 | 5.56 | 5.56 |
| Capital Expenditure | -7,868.4 | -5,363.8 | -5,523.9 | -11,436.5 | -16,014.1 | -8,452.3 | -8,183.7 | -7,923.6 | -7,671.8 | -7,428.0 |
| Capital Expenditure, % | -0.83348 | -0.60968 | -0.55848 | -2.71 | -2.73 | -1.49 | -1.49 | -1.49 | -1.49 | -1.49 |
| Tax Rate, % | 31.97 | 31.97 | 31.97 | 31.97 | 31.97 | 31.97 | 31.97 | 31.97 | 31.97 | 31.97 |
| EBITAT | 22,483.3 | 36,754.4 | 33,484.5 | 85,745.0 | 177,231.5 | 69,168.8 | 66,970.7 | 64,842.4 | 62,781.8 | 60,786.7 |
| Depreciation | ||||||||||
| Changes in Account Receivables | ||||||||||
| Changes in Inventories | ||||||||||
| Changes in Accounts Payable | ||||||||||
| Capital Expenditure | ||||||||||
| UFCF | -46,751.0 | 1,458,393.1 | 252,327.9 | -131,814.0 | -1,388,313.5 | 508,048.2 | 57,486.9 | 55,660.0 | 53,891.2 | 52,178.6 |
| WACC, % | 16.29 | 21.16 | 17.65 | 17.48 | 18.35 | 18.19 | 18.19 | 18.19 | 18.19 | 18.19 |
| PV UFCF | ||||||||||
| SUM PV UFCF | 554,983.3 | |||||||||
| Long Term Growth Rate, % | 2.00 | |||||||||
| Free cash flow (T + 1) | 53,222 | |||||||||
| Terminal Value | 328,781 | |||||||||
| Present Terminal Value | 142,576 | |||||||||
| Enterprise Value | 697,559 | |||||||||
| Net Debt | -449,530 | |||||||||
| Equity Value | 1,147,089 | |||||||||
| Diluted Shares Outstanding, MM | 11,255 | |||||||||
| Equity Value Per Share | 101.92 |
What You Will Receive
- Genuine PNB Data: Comprehensive financials – from revenue to EBIT – derived from actual and projected data.
- Complete Customization: Modify all key parameters (yellow cells) such as WACC, growth %, and tax rates.
- Real-Time Valuation Updates: Automatic recalculations to assess the effects of changes on PNB's fair value.
- Flexible Excel Template: Designed for easy edits, scenario analysis, and in-depth projections.
- Efficient and Precise: Eliminate the need to create models from scratch while ensuring accuracy and adaptability.
Key Features
- 🔍 Real-Life PNBNS Financials: Comprehensive historical and projected data for Punjab National Bank.
- ✏️ Fully Customizable Inputs: Modify all essential parameters (yellow cells) such as WACC, growth %, and tax rates.
- 📊 Professional DCF Valuation: Integrated formulas to determine Punjab National Bank’s intrinsic value using the Discounted Cash Flow method.
- ⚡ Instant Results: Immediately visualize PNBNS’s valuation after adjustments.
- Scenario Analysis: Evaluate and compare outcomes for different financial assumptions side-by-side.
How It Operates
- Download the Template: Gain immediate access to the Excel-based PNB DCF Calculator.
- Input Your Assumptions: Modify the yellow-highlighted cells for growth rates, WACC, margins, and other parameters.
- Instant Calculations: The model automatically recalculates the intrinsic value of Punjab National Bank (PNBNS).
- Test Scenarios: Experiment with different assumptions to assess potential changes in valuation.
- Analyze and Decide: Utilize the results to inform your investment or financial strategy.
Why Choose the PNBNS Calculator?
- Designed for Experts: A sophisticated tool tailored for analysts, financial officers, and consultants.
- Comprehensive Data: PNB’s historical and projected financials pre-installed for enhanced precision.
- Flexible Scenario Analysis: Effortlessly test various forecasts and assumptions.
- Concise Outputs: Automatically generates intrinsic value, NPV, and essential metrics.
- User-Friendly: Step-by-step guidance to facilitate your calculations.
Who Should Utilize This Service?
- Individual Investors: Make informed decisions about buying or selling Punjab National Bank shares (PNBNS).
- Financial Analysts: Enhance valuation processes with ready-to-use financial models tailored for Punjab National Bank (PNBNS).
- Consultants: Provide clients with prompt and accurate valuation insights regarding Punjab National Bank (PNBNS).
- Business Owners: Gain a deeper understanding of how major banks like Punjab National Bank (PNBNS) are valued to inform your strategic decisions.
- Finance Students: Explore valuation techniques using real-world data and case studies related to Punjab National Bank (PNBNS).
Contents of the Template
- Pre-Filled Data: Contains historical financial data and forecasts for Punjab National Bank (PNBNS).
- Discounted Cash Flow Model: An editable DCF valuation model featuring automated calculations.
- Weighted Average Cost of Capital (WACC): A specific sheet designed for WACC calculations using tailored inputs.
- Key Financial Ratios: Assess Punjab National Bank’s (PNBNS) profitability, efficiency, and leverage metrics.
- Customizable Inputs: Easily modify revenue growth, profit margins, and tax rates.
- Clear Dashboard: Visual representations with charts and tables summarizing important valuation outcomes.
Disclaimer
All information, articles, and product details provided on this website are for general informational and educational purposes only. We do not claim any ownership over, nor do we intend to infringe upon, any trademarks, copyrights, logos, brand names, or other intellectual property mentioned or depicted on this site. Such intellectual property remains the property of its respective owners, and any references here are made solely for identification or informational purposes, without implying any affiliation, endorsement, or partnership.
We make no representations or warranties, express or implied, regarding the accuracy, completeness, or suitability of any content or products presented. Nothing on this website should be construed as legal, tax, investment, financial, medical, or other professional advice. In addition, no part of this site—including articles or product references—constitutes a solicitation, recommendation, endorsement, advertisement, or offer to buy or sell any securities, franchises, or other financial instruments, particularly in jurisdictions where such activity would be unlawful.
All content is of a general nature and may not address the specific circumstances of any individual or entity. It is not a substitute for professional advice or services. Any actions you take based on the information provided here are strictly at your own risk. You accept full responsibility for any decisions or outcomes arising from your use of this website and agree to release us from any liability in connection with your use of, or reliance upon, the content or products found herein.