
|
Plus Therapeutics, Inc. (PSTV) DCF -Bewertung |
Fully Editable: Tailor To Your Needs In Excel Or Sheets
Professional Design: Trusted, Industry-Standard Templates
Investor-Approved Valuation Models
MAC/PC Compatible, Fully Unlocked
No Expertise Is Needed; Easy To Follow
Plus Therapeutics, Inc. (PSTV) Bundle
Entdecken Sie das wahre Potenzial von Plus Therapeutics, Inc. (PSTV) mit unserem fortschrittlichen DCF -Taschenrechner! Passen Sie die wichtigsten Annahmen an, erkunden Sie verschiedene Szenarien und bewerten Sie, wie Änderungen die Bewertung von Plus Therapeutics, Inc. (PSTV) beeinflussen - alles innerhalb einer umfassenden Excel -Vorlage.
What You Will Receive
- Comprehensive Financial Model: Plus Therapeutics' actual data facilitates accurate DCF valuation.
- Complete Forecast Control: Modify revenue growth, profit margins, WACC, and other critical factors.
- Real-Time Calculations: Instant updates allow you to view results as adjustments are made.
- Professional-Grade Template: A polished Excel file crafted for high-quality valuation.
- Flexible and Reusable: Designed for adaptability, enabling repeated use for in-depth forecasts.
Key Features
- Customizable Treatment Parameters: Adjust essential factors such as dosing regimens, patient demographics, and clinical endpoints.
- Real-Time Data Analysis: Provides instant insights into trial outcomes, patient responses, and statistical significance.
- High-Precision Modeling: Utilizes Plus Therapeutics, Inc.'s (PSTV) proprietary data for accurate therapeutic evaluations.
- Effortless Scenario Testing: Easily explore various treatment scenarios and their potential impacts.
- Efficiency Booster: Streamlines the process of developing complex clinical trial models without starting from scratch.
How It Works
- Step 1: Download the Excel file for Plus Therapeutics, Inc. (PSTV).
- Step 2: Review the pre-filled financial data and projections for Plus Therapeutics.
- Step 3: Adjust key inputs such as revenue growth, WACC, and tax rates (highlighted cells).
- Step 4: Observe the DCF model update in real-time as you adjust your assumptions.
- Step 5: Evaluate the outputs and leverage the results for your investment strategies.
Why Choose Plus Therapeutics Calculator?
- Accuracy: Utilizes real Plus Therapeutics financial data to ensure precision.
- Flexibility: Allows users to easily test and adjust inputs as needed.
- Time-Saving: Eliminate the complexity of creating a financial model from the ground up.
- Professional-Grade: Crafted with the expertise and usability expected at the CFO level.
- User-Friendly: Intuitive interface designed for users of all financial backgrounds.
Who Should Use Plus Therapeutics, Inc. (PSTV)?
- Investors: Gain insights into innovative therapies and make informed investment choices.
- Healthcare Analysts: Utilize comprehensive data to evaluate market potential and therapeutic efficacy.
- Consultants: Tailor the information for client briefings or strategic planning sessions.
- Biotech Enthusiasts: Explore cutting-edge developments in the biotech field through real-world case studies.
- Educators and Students: Leverage the resources for practical applications in biotechnology and pharmaceutical courses.
What the Template Contains
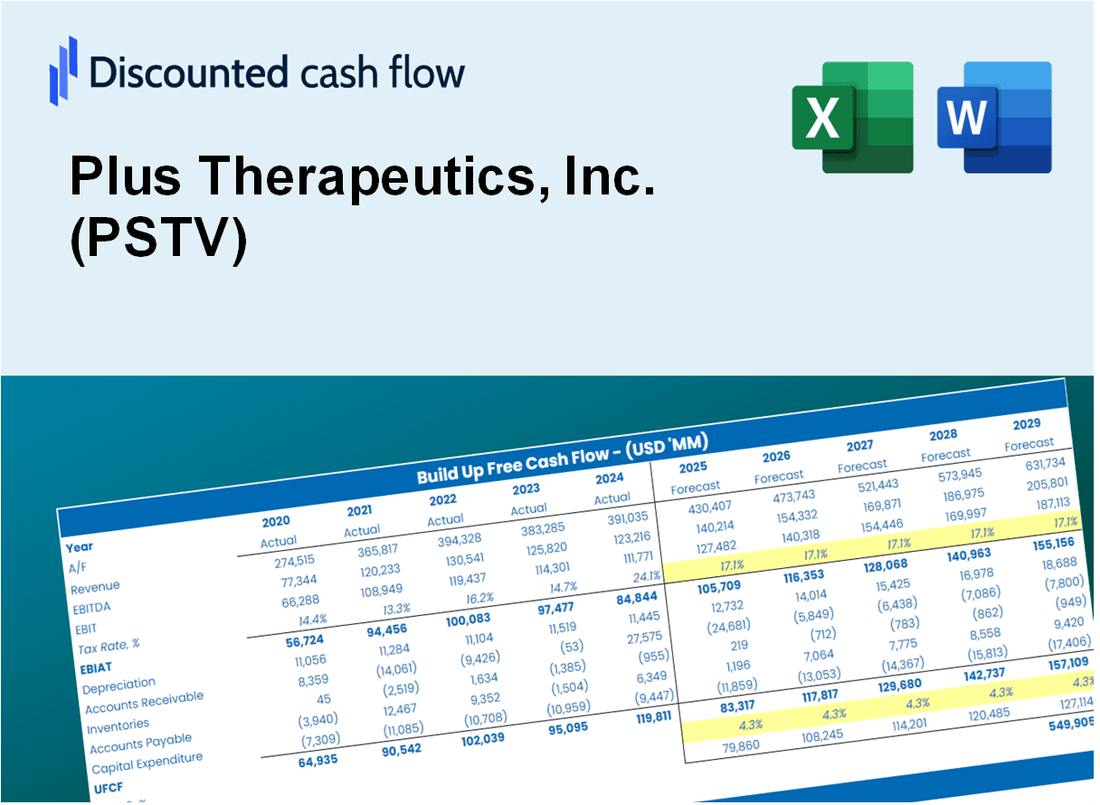
- Operating and Balance Sheet Data: Pre-filled Plus Therapeutics, Inc. (PSTV) historical data and forecasts, including revenue, EBITDA, EBIT, and capital expenditures.
- WACC Calculation: A dedicated sheet for Weighted Average Cost of Capital (WACC), including parameters like Beta, risk-free rate, and share price.
- DCF Valuation (Unlevered and Levered): Editable Discounted Cash Flow models showing intrinsic value with detailed calculations.
- Financial Statements: Pre-loaded financial statements (annual and quarterly) to support analysis.
- Key Ratios: Includes profitability, leverage, and efficiency ratios for Plus Therapeutics, Inc. (PSTV).
- Dashboard and Charts: Visual summary of valuation outputs and assumptions to analyze results easily.
Disclaimer
All information, articles, and product details provided on this website are for general informational and educational purposes only. We do not claim any ownership over, nor do we intend to infringe upon, any trademarks, copyrights, logos, brand names, or other intellectual property mentioned or depicted on this site. Such intellectual property remains the property of its respective owners, and any references here are made solely for identification or informational purposes, without implying any affiliation, endorsement, or partnership.
We make no representations or warranties, express or implied, regarding the accuracy, completeness, or suitability of any content or products presented. Nothing on this website should be construed as legal, tax, investment, financial, medical, or other professional advice. In addition, no part of this site—including articles or product references—constitutes a solicitation, recommendation, endorsement, advertisement, or offer to buy or sell any securities, franchises, or other financial instruments, particularly in jurisdictions where such activity would be unlawful.
All content is of a general nature and may not address the specific circumstances of any individual or entity. It is not a substitute for professional advice or services. Any actions you take based on the information provided here are strictly at your own risk. You accept full responsibility for any decisions or outcomes arising from your use of this website and agree to release us from any liability in connection with your use of, or reliance upon, the content or products found herein.