
|
Quad/Graphics, Inc. (Quad) DCF -Bewertung |
Fully Editable: Tailor To Your Needs In Excel Or Sheets
Professional Design: Trusted, Industry-Standard Templates
Investor-Approved Valuation Models
MAC/PC Compatible, Fully Unlocked
No Expertise Is Needed; Easy To Follow
Quad/Graphics, Inc. (QUAD) Bundle
Verbessern Sie Ihre Bewertungsanalyse für Quad/Graphics, Inc. (Quad) mit unserem hochkarätigen DCF-Taschenrechner! Mit dieser Excel -Vorlage mit realen (Quad-) Daten können Sie Prognosen und Annahmen anpassen, um den inneren Wert von Quad/Graphics, Inc. genau zu bestimmen.
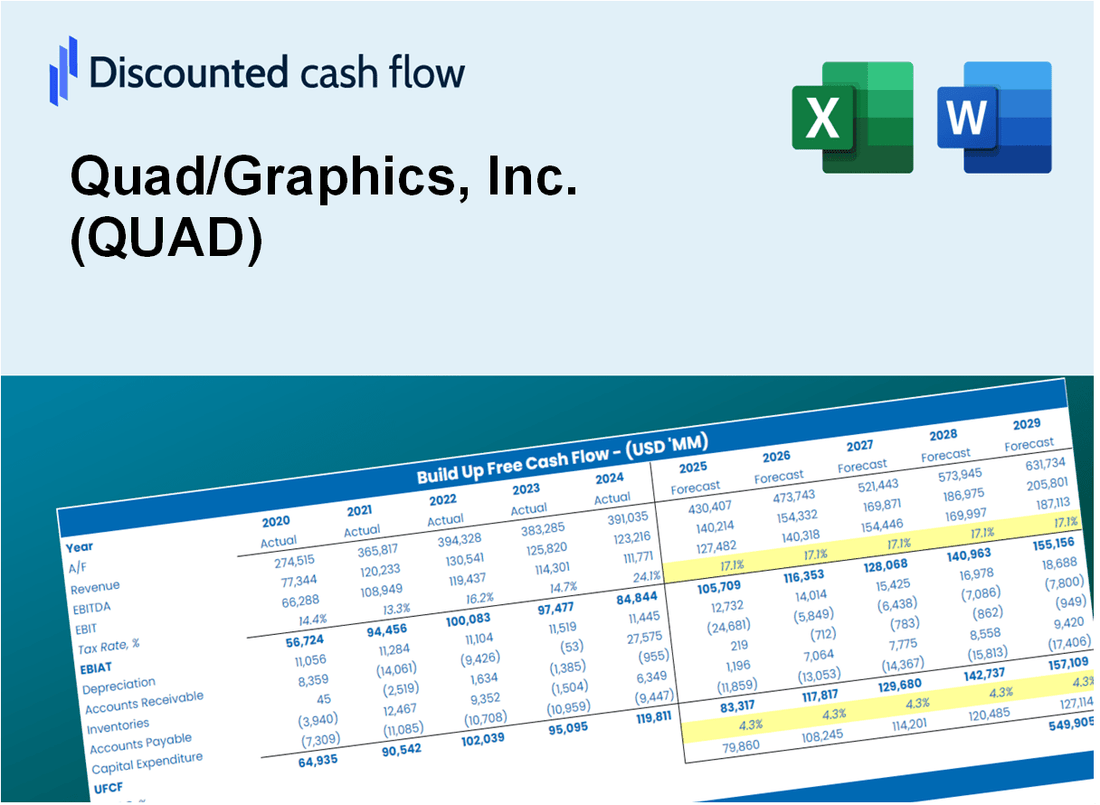
Discounted Cash Flow (DCF) - (USD MM)
| Year | AY1 2020 |
AY2 2021 |
AY3 2022 |
AY4 2023 |
AY5 2024 |
FY1 2025 |
FY2 2026 |
FY3 2027 |
FY4 2028 |
FY5 2029 |
|---|---|---|---|---|---|---|---|---|---|---|
| Revenue | 2,929.6 | 2,960.4 | 3,217.0 | 2,957.7 | 2,672.2 | 2,618.8 | 2,566.5 | 2,515.2 | 2,464.9 | 2,415.6 |
| Revenue Growth, % | 0 | 1.05 | 8.67 | -8.06 | -9.65 | -2 | -2 | -2 | -2 | -2 |
| EBITDA | 150.4 | 266.1 | 213.0 | 150.6 | 121.0 | 159.0 | 155.9 | 152.7 | 149.7 | 146.7 |
| EBITDA, % | 5.13 | 8.99 | 6.62 | 5.09 | 4.53 | 6.07 | 6.07 | 6.07 | 6.07 | 6.07 |
| Depreciation | 181.6 | 157.3 | 141.3 | 128.8 | 102.5 | 126.2 | 123.7 | 121.2 | 118.8 | 116.4 |
| Depreciation, % | 6.2 | 5.31 | 4.39 | 4.35 | 3.84 | 4.82 | 4.82 | 4.82 | 4.82 | 4.82 |
| EBIT | -31.2 | 108.8 | 71.7 | 21.8 | 18.5 | 32.8 | 32.2 | 31.5 | 30.9 | 30.3 |
| EBIT, % | -1.06 | 3.68 | 2.23 | 0.73706 | 0.69231 | 1.25 | 1.25 | 1.25 | 1.25 | 1.25 |
| Total Cash | 55.2 | 179.9 | 25.2 | 52.9 | 29.2 | 60.9 | 59.7 | 58.5 | 57.3 | 56.2 |
| Total Cash, percent | .0 | .0 | .0 | .0 | .0 | .0 | .0 | .0 | .0 | .0 |
| Account Receivables | 399.1 | 362.0 | 372.6 | 316.2 | 273.2 | 305.6 | 299.5 | 293.5 | 287.6 | 281.9 |
| Account Receivables, % | 13.62 | 12.23 | 11.58 | 10.69 | 10.22 | 11.67 | 11.67 | 11.67 | 11.67 | 11.67 |
| Inventories | 170.2 | 226.2 | 260.7 | 178.8 | 162.4 | 176.4 | 172.9 | 169.4 | 166.0 | 162.7 |
| Inventories, % | 5.81 | 7.64 | 8.1 | 6.05 | 6.08 | 6.74 | 6.74 | 6.74 | 6.74 | 6.74 |
| Accounts Payable | 320.0 | 367.3 | 456.6 | 373.6 | 356.7 | 332.6 | 326.0 | 319.4 | 313.1 | 306.8 |
| Accounts Payable, % | 10.92 | 12.41 | 14.19 | 12.63 | 13.35 | 12.7 | 12.7 | 12.7 | 12.7 | 12.7 |
| Capital Expenditure | -61.0 | -50.0 | -60.3 | -70.8 | -57.2 | -53.3 | -52.3 | -51.2 | -50.2 | -49.2 |
| Capital Expenditure, % | -2.08 | -1.69 | -1.87 | -2.39 | -2.14 | -2.04 | -2.04 | -2.04 | -2.04 | -2.04 |
| Tax Rate, % | -14.38 | -14.38 | -14.38 | -14.38 | -14.38 | -14.38 | -14.38 | -14.38 | -14.38 | -14.38 |
| EBITAT | -37.7 | 86.9 | 37.7 | 28.4 | 21.2 | 28.4 | 27.8 | 27.3 | 26.7 | 26.2 |
| Depreciation | ||||||||||
| Changes in Account Receivables | ||||||||||
| Changes in Inventories | ||||||||||
| Changes in Accounts Payable | ||||||||||
| Capital Expenditure | ||||||||||
| UFCF | -166.4 | 222.6 | 162.9 | 141.7 | 109.0 | 30.8 | 102.2 | 100.2 | 98.2 | 96.2 |
| WACC, % | 12.08 | 10.31 | 7.89 | 12.08 | 12.08 | 10.89 | 10.89 | 10.89 | 10.89 | 10.89 |
| PV UFCF | ||||||||||
| SUM PV UFCF | 306.8 | |||||||||
| Long Term Growth Rate, % | 2.00 | |||||||||
| Free cash flow (T + 1) | 98 | |||||||||
| Terminal Value | 1,104 | |||||||||
| Present Terminal Value | 659 | |||||||||
| Enterprise Value | 966 | |||||||||
| Net Debt | 435 | |||||||||
| Equity Value | 530 | |||||||||
| Diluted Shares Outstanding, MM | 48 | |||||||||
| Equity Value Per Share | 11.14 |
What You Will Get
- Editable Forecast Inputs: Easily modify assumptions (growth %, margins, WACC) to explore various scenarios.
- Real-World Data: Quad/Graphics, Inc. (QUAD)’s financial data pre-filled to facilitate your analysis.
- Automatic DCF Outputs: The template computes Net Present Value (NPV) and intrinsic value for you.
- Customizable and Professional: A refined Excel model that adjusts to your valuation requirements.
- Built for Analysts and Investors: Perfect for evaluating projections, validating strategies, and enhancing efficiency.
Key Features
- Customizable Financial Metrics: Adjust essential inputs such as revenue forecasts, operating margins, and capital investments.
- Instant DCF Valuation: Provides immediate calculations for intrinsic value, net present value, and additional financial metrics.
- High-Precision Accuracy: Leverages Quad/Graphics, Inc.'s (QUAD) actual financial data for realistic valuation assessments.
- Effortless Scenario Analysis: Easily explore various assumptions and analyze different outcomes.
- Efficiency Booster: Streamline the valuation process without the hassle of creating complex models from the ground up.
How It Works
- Download the Template: Gain immediate access to the Excel-based QUAD DCF Calculator.
- Input Your Assumptions: Modify the yellow-highlighted cells for growth rates, WACC, margins, and additional parameters.
- Instant Calculations: The model automatically recalculates Quad/Graphics’ intrinsic value.
- Test Scenarios: Experiment with various assumptions to assess potential valuation fluctuations.
- Analyze and Decide: Utilize the outcomes to inform your investment or financial analysis.
Why Choose Quad/Graphics, Inc. (QUAD)?
- Streamlined Processes: Eliminate the hassle of building from the ground up – our tools are ready for immediate use.
- Enhanced Precision: Access to accurate data and proven formulas minimizes valuation discrepancies.
- Completely Adaptable: Modify the tools to align with your specific assumptions and forecasts.
- User-Friendly Design: Intuitive visuals and outputs facilitate straightforward analysis of results.
- Endorsed by Professionals: Crafted for industry experts who prioritize accuracy and functionality.
Who Should Use Quad/Graphics, Inc. (QUAD)?
- Individual Investors: Gain insights for making informed decisions regarding investments in Quad/Graphics, Inc. (QUAD).
- Financial Analysts: Enhance valuation processes with comprehensive financial models tailored for Quad/Graphics, Inc. (QUAD).
- Consultants: Provide clients with accurate and timely valuation assessments of Quad/Graphics, Inc. (QUAD).
- Business Owners: Learn from the valuation strategies of established companies like Quad/Graphics, Inc. (QUAD) to refine your own business approach.
- Finance Students: Explore real-world valuation techniques using data and case studies related to Quad/Graphics, Inc. (QUAD).
What the Template Contains
- Pre-Filled Data: Includes Quad/Graphics, Inc.'s historical financials and forecasts.
- Discounted Cash Flow Model: Editable DCF valuation model with automatic calculations.
- Weighted Average Cost of Capital (WACC): A dedicated sheet for calculating WACC based on custom inputs.
- Key Financial Ratios: Analyze Quad/Graphics, Inc.'s profitability, efficiency, and leverage.
- Customizable Inputs: Edit revenue growth, margins, and tax rates with ease.
- Clear Dashboard: Charts and tables summarizing key valuation results.
Disclaimer
All information, articles, and product details provided on this website are for general informational and educational purposes only. We do not claim any ownership over, nor do we intend to infringe upon, any trademarks, copyrights, logos, brand names, or other intellectual property mentioned or depicted on this site. Such intellectual property remains the property of its respective owners, and any references here are made solely for identification or informational purposes, without implying any affiliation, endorsement, or partnership.
We make no representations or warranties, express or implied, regarding the accuracy, completeness, or suitability of any content or products presented. Nothing on this website should be construed as legal, tax, investment, financial, medical, or other professional advice. In addition, no part of this site—including articles or product references—constitutes a solicitation, recommendation, endorsement, advertisement, or offer to buy or sell any securities, franchises, or other financial instruments, particularly in jurisdictions where such activity would be unlawful.
All content is of a general nature and may not address the specific circumstances of any individual or entity. It is not a substitute for professional advice or services. Any actions you take based on the information provided here are strictly at your own risk. You accept full responsibility for any decisions or outcomes arising from your use of this website and agree to release us from any liability in connection with your use of, or reliance upon, the content or products found herein.