
|
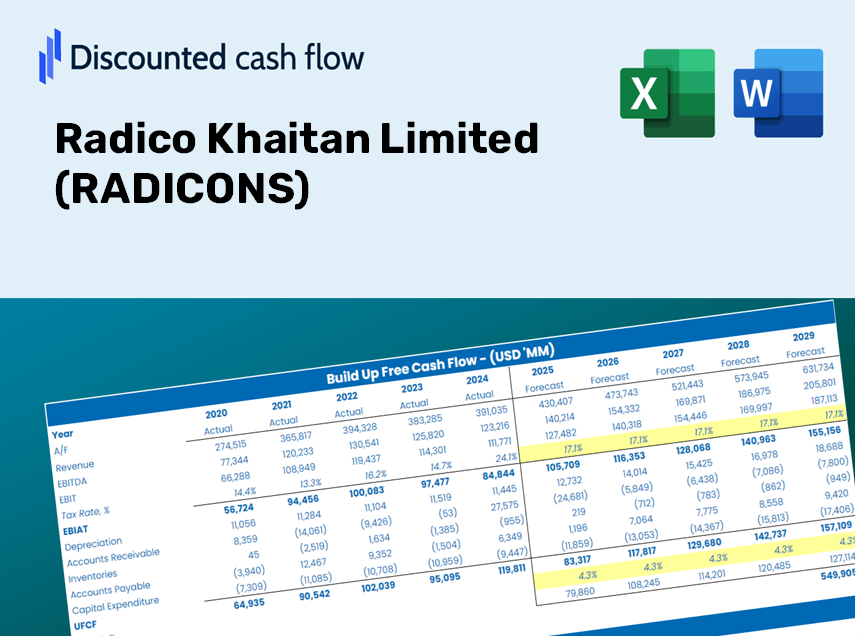
Radico Khaitan Limited (Radico.NS) DCF -Bewertung |
Fully Editable: Tailor To Your Needs In Excel Or Sheets
Professional Design: Trusted, Industry-Standard Templates
Investor-Approved Valuation Models
MAC/PC Compatible, Fully Unlocked
No Expertise Is Needed; Easy To Follow
Radico Khaitan Limited (RADICO.NS) Bundle
Verbessern Sie Ihre Investitionsauswahl mit dem Radico Khaitan Limited (Radicons) DCF -Taschenrechner! Analysieren Sie echte Finanzdaten, passen Sie die Wachstumsvorhersagen und -kosten an und beobachten Sie, wie sich diese Modifikationen in Echtzeit auf den inneren Wert von Radico Khaitan Limited (Radicons) auswirken.
Benefits You Will Receive
- Pre-Filled Financial Model: Leverage Radico Khaitan Limited’s (RADICONS) actual data for accurate DCF valuation.
- Comprehensive Forecast Control: Modify key metrics such as revenue growth, profit margins, WACC, and more.
- Real-Time Calculations: Enjoy automatic updates that display results instantly as you make adjustments.
- Professional-Grade Template: A polished Excel file crafted for high-level valuation analysis.
- Flexible and Reusable: Designed for customization, allowing for repeated applications in detailed forecasting.
Key Features
- Pre-Loaded Data: Radico Khaitan Limited's historical financial statements and pre-filled projections.
- Fully Adjustable Inputs: Customize WACC, tax rates, revenue growth, and EBITDA margins to fit your analysis.
- Instant Results: Watch the intrinsic value of Radico Khaitan Limited (RADICONS) update in real time.
- Clear Visual Outputs: Intuitive dashboard charts present valuation results and essential metrics.
- Built for Accuracy: A professional-grade tool designed for analysts, investors, and finance professionals.
Our Process
- Download the Template: Gain immediate access to the Excel-based RADICONS DCF Calculator.
- Input Your Assumptions: Modify the yellow-highlighted cells for growth rates, WACC, margins, and additional variables.
- Instant Calculations: The model automatically refreshes to reflect Radico Khaitan Limited’s intrinsic value.
- Test Scenarios: Experiment with various assumptions to assess potential valuation shifts.
- Analyze and Decide: Leverage the findings to inform your investment or financial evaluations.
Why Choose the Radico Khaitan Limited (RADICONS) Calculator?
- All-in-One Solution: Offers DCF, WACC, and various financial ratio analyses in a single toolkit.
- Flexible Inputs: Modify the yellow-highlighted cells to explore different financial scenarios.
- In-Depth Analysis: Automatically computes Radico Khaitan Limited's intrinsic value and Net Present Value.
- Preloaded Information: Utilizes historical and projected data for reliable starting points.
- High-Quality Standards: Perfect for financial analysts, investors, and business consultants specializing in (RADICONS).
Who Can Benefit from This Product?
- Individual Investors: Gain insights to make sound decisions regarding purchases or sales of Radico Khaitan Limited (RADICONS) stock.
- Financial Analysts: Enhance valuation techniques with pre-built financial models tailored for Radico Khaitan Limited (RADICONS).
- Consultants: Provide clients with accurate and timely valuation analysis of Radico Khaitan Limited (RADICONS).
- Business Owners: Learn how major enterprises like Radico Khaitan Limited (RADICONS) are valued to inform your own business strategies.
- Finance Students: Explore valuation methodologies using real-time data and case studies involving Radico Khaitan Limited (RADICONS).
Contents of the Template
- Comprehensive DCF Model: An editable framework featuring detailed valuation calculations.
- Real-World Data: Radico Khaitan Limited’s (RADICONS) historical and projected financials preloaded for in-depth analysis.
- Customizable Parameters: Modify WACC, growth rates, and tax assumptions to explore different scenarios.
- Financial Statements: Complete annual and quarterly breakdowns for enhanced insights.
- Key Ratios: Integrated analysis for assessing profitability, efficiency, and leverage.
- Dashboard with Visual Outputs: Charts and tables designed for clear, actionable results.
Disclaimer
All information, articles, and product details provided on this website are for general informational and educational purposes only. We do not claim any ownership over, nor do we intend to infringe upon, any trademarks, copyrights, logos, brand names, or other intellectual property mentioned or depicted on this site. Such intellectual property remains the property of its respective owners, and any references here are made solely for identification or informational purposes, without implying any affiliation, endorsement, or partnership.
We make no representations or warranties, express or implied, regarding the accuracy, completeness, or suitability of any content or products presented. Nothing on this website should be construed as legal, tax, investment, financial, medical, or other professional advice. In addition, no part of this site—including articles or product references—constitutes a solicitation, recommendation, endorsement, advertisement, or offer to buy or sell any securities, franchises, or other financial instruments, particularly in jurisdictions where such activity would be unlawful.
All content is of a general nature and may not address the specific circumstances of any individual or entity. It is not a substitute for professional advice or services. Any actions you take based on the information provided here are strictly at your own risk. You accept full responsibility for any decisions or outcomes arising from your use of this website and agree to release us from any liability in connection with your use of, or reliance upon, the content or products found herein.