
|
Rallis India Limited (Rallis.NS) DCF -Bewertung |
Fully Editable: Tailor To Your Needs In Excel Or Sheets
Professional Design: Trusted, Industry-Standard Templates
Investor-Approved Valuation Models
MAC/PC Compatible, Fully Unlocked
No Expertise Is Needed; Easy To Follow
Rallis India Limited (RALLIS.NS) Bundle
Optimieren Sie Ihre Analyse und verbessern Sie die Präzision mit unserem (Rallisns) DCF -Taschenrechner! Mit tatsächlichen Daten von Rallis India Limited und der Ermöglichung anpassbarer Annahmen ermöglichen dieses Tool Sie, wie ein erfahrener Investor prognostiziert, analysieren und beurteilen (Rallisns).
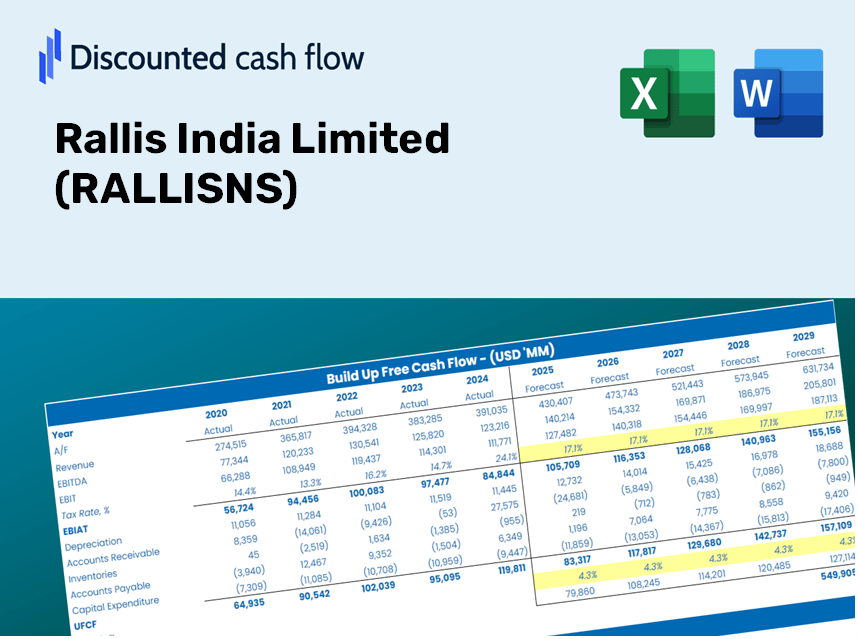
Discounted Cash Flow (DCF) - (USD MM)
| Year | AY1 2021 |
AY2 2022 |
AY3 2023 |
AY4 2024 |
AY5 2025 |
FY1 2026 |
FY2 2027 |
FY3 2028 |
FY4 2029 |
FY5 2030 |
|---|---|---|---|---|---|---|---|---|---|---|
| Revenue | 24,190.3 | 25,911.3 | 29,669.7 | 26,325.4 | 26,630.0 | 27,395.9 | 28,183.9 | 28,994.5 | 29,828.4 | 30,686.3 |
| Revenue Growth, % | 0 | 7.11 | 14.5 | -11.27 | 1.16 | 2.88 | 2.88 | 2.88 | 2.88 | 2.88 |
| EBITDA | 3,743.4 | 3,034.6 | 2,332.2 | 3,280.0 | 3,190.0 | 3,259.3 | 3,353.0 | 3,449.5 | 3,548.7 | 3,650.8 |
| EBITDA, % | 15.47 | 11.71 | 7.86 | 12.46 | 11.98 | 11.9 | 11.9 | 11.9 | 11.9 | 11.9 |
| Depreciation | 640.7 | 743.1 | 913.5 | 1,139.4 | 1,200.0 | 955.0 | 982.5 | 1,010.7 | 1,039.8 | 1,069.7 |
| Depreciation, % | 2.65 | 2.87 | 3.08 | 4.33 | 4.51 | 3.49 | 3.49 | 3.49 | 3.49 | 3.49 |
| EBIT | 3,102.7 | 2,291.5 | 1,418.7 | 2,140.6 | 1,990.0 | 2,304.3 | 2,370.6 | 2,438.8 | 2,508.9 | 2,581.1 |
| EBIT, % | 12.83 | 8.84 | 4.78 | 8.13 | 7.47 | 8.41 | 8.41 | 8.41 | 8.41 | 8.41 |
| Total Cash | 3,356.8 | 2,725.7 | 2,710.0 | 2,792.9 | 4,373.0 | 3,318.2 | 3,413.6 | 3,511.8 | 3,612.8 | 3,716.7 |
| Total Cash, percent | .0 | .0 | .0 | .0 | .0 | .0 | .0 | .0 | .0 | .0 |
| Account Receivables | 4,610.0 | 5,026.2 | 5,479.5 | 6,644.5 | 5,410.0 | 5,615.0 | 5,776.5 | 5,942.6 | 6,113.5 | 6,289.4 |
| Account Receivables, % | 19.06 | 19.4 | 18.47 | 25.24 | 20.32 | 20.5 | 20.5 | 20.5 | 20.5 | 20.5 |
| Inventories | 8,031.7 | 9,473.7 | 8,073.3 | 8,241.6 | 7,510.0 | 8,574.0 | 8,820.6 | 9,074.3 | 9,335.2 | 9,603.7 |
| Inventories, % | 33.2 | 36.56 | 27.21 | 31.31 | 28.2 | 31.3 | 31.3 | 31.3 | 31.3 | 31.3 |
| Accounts Payable | 5,960.7 | 7,525.3 | 5,882.5 | 5,998.3 | 5,410.0 | 6,389.3 | 6,573.1 | 6,762.1 | 6,956.6 | 7,156.7 |
| Accounts Payable, % | 24.64 | 29.04 | 19.83 | 22.79 | 20.32 | 23.32 | 23.32 | 23.32 | 23.32 | 23.32 |
| Capital Expenditure | -1,684.9 | -1,850.2 | -1,879.0 | -820.0 | -740.0 | -1,442.8 | -1,484.3 | -1,527.0 | -1,570.9 | -1,616.1 |
| Capital Expenditure, % | -6.97 | -7.14 | -6.33 | -3.11 | -2.78 | -5.27 | -5.27 | -5.27 | -5.27 | -5.27 |
| Tax Rate, % | 33.16 | 33.16 | 33.16 | 33.16 | 33.16 | 33.16 | 33.16 | 33.16 | 33.16 | 33.16 |
| EBITAT | 2,336.7 | 1,692.5 | 1,019.2 | 1,617.8 | 1,330.2 | 1,674.9 | 1,723.1 | 1,772.6 | 1,823.6 | 1,876.1 |
| Depreciation | ||||||||||
| Changes in Account Receivables | ||||||||||
| Changes in Inventories | ||||||||||
| Changes in Accounts Payable | ||||||||||
| Capital Expenditure | ||||||||||
| UFCF | -5,388.5 | 291.8 | -642.0 | 719.6 | 3,168.0 | 897.5 | 996.9 | 1,025.6 | 1,055.1 | 1,085.4 |
| WACC, % | 5.07 | 5.07 | 5.06 | 5.07 | 5.05 | 5.07 | 5.07 | 5.07 | 5.07 | 5.07 |
| PV UFCF | ||||||||||
| SUM PV UFCF | 4,355.2 | |||||||||
| Long Term Growth Rate, % | 3.50 | |||||||||
| Free cash flow (T + 1) | 1,123 | |||||||||
| Terminal Value | 71,707 | |||||||||
| Present Terminal Value | 56,006 | |||||||||
| Enterprise Value | 60,361 | |||||||||
| Net Debt | 350 | |||||||||
| Equity Value | 60,011 | |||||||||
| Diluted Shares Outstanding, MM | 194 | |||||||||
| Equity Value Per Share | 308.70 |
Benefits You'll Receive
- Authentic RALLIS Financial Data: Comes pre-filled with Rallis India Limited’s historical and forecasted data for in-depth analysis.
- Completely Editable Template: Effortlessly adjust key variables such as revenue growth, WACC, and EBITDA percentage.
- Instant Calculations: Watch Rallis India’s intrinsic value refresh immediately as you make updates.
- Comprehensive Valuation Tool: Tailored for investors, analysts, and consultants aiming for precise DCF outcomes.
- Intuitive Layout: Easy-to-navigate structure and straightforward instructions suitable for all levels of expertise.
Key Features
- Authentic Rallis Financial Data: Obtain precise pre-loaded historical figures and future forecasts for Rallis India Limited (RALLISNS).
- Tailored Forecasting Assumptions: Modify yellow-highlighted fields such as WACC, growth rates, and profit margins to suit your analysis.
- Dynamic Calculations: Instant updates to DCF, Net Present Value (NPV), and cash flow analyses as you make adjustments.
- User-Friendly Dashboard: Clear and concise charts and summaries to help you visualize the valuation outcomes effectively.
- Suitable for All Experience Levels: An intuitive layout designed for investors, CFOs, and consultants alike, from novices to experts.
How It Functions
- Download: Obtain the pre-configured Excel file containing Rallis India Limited’s (RALLISNS) financial metrics.
- Customize: Tailor forecasts such as revenue growth, EBITDA %, and WACC to fit your needs.
- Update Automatically: Enjoy real-time updates on intrinsic value and NPV calculations.
- Test Scenarios: Generate various projections and instantly analyze the results.
- Make Decisions: Leverage the valuation insights to inform your investment approach.
Why Choose This Calculator for Rallis India Limited (RALLISNS)?
- Designed for Experts: A sophisticated tool tailored for analysts, CFOs, and consultants.
- Accurate Data: Historical and projected financials for Rallis India Limited preloaded for precision.
- Scenario Analysis: Effortlessly simulate various forecasts and assumptions.
- Comprehensive Outputs: Automatically computes intrinsic value, NPV, and essential metrics.
- User-Friendly: Step-by-step guidance to help you navigate the process with ease.
Who Can Benefit from This Product?
- Finance Students: Discover valuation methodologies and practice with actual market data.
- Academics: Integrate advanced financial models into your teaching or research projects.
- Investors: Evaluate your hypotheses and assess valuation results for Rallis India Limited (RALLISNS) stock.
- Analysts: Enhance your efficiency with a ready-to-use, customizable DCF model.
- Small Business Owners: Understand the analytical approaches used for evaluating large, publicly traded companies like Rallis India Limited (RALLISNS).
Contents of the Template
- Historical Data: Contains Rallis India Limited's past financial performance and foundational forecasts.
- DCF and Levered DCF Models: Comprehensive templates for assessing the intrinsic value of Rallis India Limited (RALLISNS).
- WACC Sheet: Pre-configured calculations for the Weighted Average Cost of Capital.
- Editable Inputs: Customize essential parameters such as growth rates, EBITDA %, and CAPEX assumptions.
- Quarterly and Annual Statements: A thorough analysis of Rallis India Limited's financial statements.
- Interactive Dashboard: Dynamically visualize valuation outcomes and future projections.
Disclaimer
All information, articles, and product details provided on this website are for general informational and educational purposes only. We do not claim any ownership over, nor do we intend to infringe upon, any trademarks, copyrights, logos, brand names, or other intellectual property mentioned or depicted on this site. Such intellectual property remains the property of its respective owners, and any references here are made solely for identification or informational purposes, without implying any affiliation, endorsement, or partnership.
We make no representations or warranties, express or implied, regarding the accuracy, completeness, or suitability of any content or products presented. Nothing on this website should be construed as legal, tax, investment, financial, medical, or other professional advice. In addition, no part of this site—including articles or product references—constitutes a solicitation, recommendation, endorsement, advertisement, or offer to buy or sell any securities, franchises, or other financial instruments, particularly in jurisdictions where such activity would be unlawful.
All content is of a general nature and may not address the specific circumstances of any individual or entity. It is not a substitute for professional advice or services. Any actions you take based on the information provided here are strictly at your own risk. You accept full responsibility for any decisions or outcomes arising from your use of this website and agree to release us from any liability in connection with your use of, or reliance upon, the content or products found herein.