
|
Redington Limited (Redington.NS) DCF -Bewertung |
Fully Editable: Tailor To Your Needs In Excel Or Sheets
Professional Design: Trusted, Industry-Standard Templates
Investor-Approved Valuation Models
MAC/PC Compatible, Fully Unlocked
No Expertise Is Needed; Easy To Follow
Redington Limited (REDINGTON.NS) Bundle
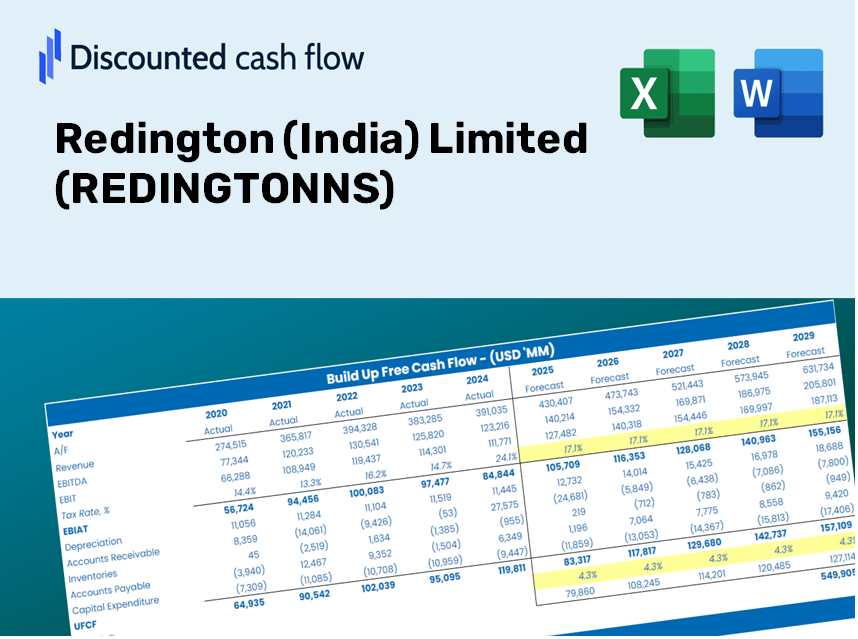
Als Investor oder Analyst ist dieser DCF-Taschenrechner von Redington (India) Limited (Redingtonns) Ihre Anlaufstelle für eine genaue Bewertung. Ausgestattet mit echten Daten von Redington können Sie Prognosen anpassen und sofort ihre Auswirkungen beobachten.
Discounted Cash Flow (DCF) - (USD MM)
| Year | AY1 2021 |
AY2 2022 |
AY3 2023 |
AY4 2024 |
AY5 2025 |
FY1 2026 |
FY2 2027 |
FY3 2028 |
FY4 2029 |
FY5 2030 |
|---|---|---|---|---|---|---|---|---|---|---|
| Revenue | 569,336.5 | 626,118.0 | 793,367.8 | 894,692.1 | 993,336.5 | 1,143,534.9 | 1,316,444.2 | 1,515,498.5 | 1,744,650.9 | 2,008,452.5 |
| Revenue Growth, % | 0 | 9.97 | 26.71 | 12.77 | 11.03 | 15.12 | 15.12 | 15.12 | 15.12 | 15.12 |
| EBITDA | 14,239.9 | 18,736.6 | 22,515.7 | 21,298.9 | 20,533.3 | 29,227.2 | 33,646.5 | 38,734.1 | 44,590.9 | 51,333.3 |
| EBITDA, % | 2.5 | 2.99 | 2.84 | 2.38 | 2.07 | 2.56 | 2.56 | 2.56 | 2.56 | 2.56 |
| Depreciation | 1,482.0 | 1,412.8 | 1,554.0 | 1,810.9 | 2,175.8 | 2,523.2 | 2,904.8 | 3,344.0 | 3,849.6 | 4,431.7 |
| Depreciation, % | 0.2603 | 0.22564 | 0.19587 | 0.2024 | 0.21904 | 0.22065 | 0.22065 | 0.22065 | 0.22065 | 0.22065 |
| EBIT | 12,757.9 | 17,323.8 | 20,961.7 | 19,488.0 | 18,357.5 | 26,704.0 | 30,741.8 | 35,390.1 | 40,741.3 | 46,901.6 |
| EBIT, % | 2.24 | 2.77 | 2.64 | 2.18 | 1.85 | 2.34 | 2.34 | 2.34 | 2.34 | 2.34 |
| Total Cash | 35,152.5 | 36,468.3 | 19,724.4 | 16,122.7 | 13,722.7 | 40,409.0 | 46,519.1 | 53,553.1 | 61,650.6 | 70,972.6 |
| Total Cash, percent | .0 | .0 | .0 | .0 | .0 | .0 | .0 | .0 | .0 | .0 |
| Account Receivables | 70,881.0 | 90,719.1 | 126,968.3 | 144,863.9 | 173,304.9 | 175,145.7 | 201,628.8 | 232,116.3 | 267,213.6 | 307,617.9 |
| Account Receivables, % | 12.45 | 14.49 | 16 | 16.19 | 17.45 | 15.32 | 15.32 | 15.32 | 15.32 | 15.32 |
| Inventories | 29,021.1 | 43,830.4 | 70,852.6 | 66,528.2 | 62,865.4 | 79,573.8 | 91,605.8 | 105,457.2 | 121,402.9 | 139,759.8 |
| Inventories, % | 5.1 | 7 | 8.93 | 7.44 | 6.33 | 6.96 | 6.96 | 6.96 | 6.96 | 6.96 |
| Accounts Payable | 72,999.5 | 101,542.0 | 109,711.1 | 118,687.4 | 133,915.5 | 159,214.8 | 183,289.1 | 211,003.5 | 242,908.5 | 279,637.7 |
| Accounts Payable, % | 12.82 | 16.22 | 13.83 | 13.27 | 13.48 | 13.92 | 13.92 | 13.92 | 13.92 | 13.92 |
| Capital Expenditure | -480.2 | -1,258.3 | -1,620.7 | -1,220.5 | -1,362.8 | -1,745.5 | -2,009.4 | -2,313.3 | -2,663.0 | -3,065.7 |
| Capital Expenditure, % | -0.08434379 | -0.20097 | -0.20428 | -0.13642 | -0.13719 | -0.15264 | -0.15264 | -0.15264 | -0.15264 | -0.15264 |
| Tax Rate, % | 31.26 | 31.26 | 31.26 | 31.26 | 31.26 | 31.26 | 31.26 | 31.26 | 31.26 | 31.26 |
| EBITAT | 8,575.3 | 13,667.1 | 15,920.9 | 15,081.7 | 12,618.1 | 19,664.0 | 22,637.3 | 26,060.2 | 30,000.7 | 34,536.9 |
| Depreciation | ||||||||||
| Changes in Account Receivables | ||||||||||
| Changes in Inventories | ||||||||||
| Changes in Accounts Payable | ||||||||||
| Capital Expenditure | ||||||||||
| UFCF | -17,325.5 | 7,716.7 | -39,248.1 | 11,077.2 | 3,881.0 | 27,191.9 | 9,091.8 | 10,466.5 | 12,049.1 | 13,871.0 |
| WACC, % | 7.69 | 7.84 | 7.8 | 7.82 | 7.71 | 7.77 | 7.77 | 7.77 | 7.77 | 7.77 |
| PV UFCF | ||||||||||
| SUM PV UFCF | 59,889.4 | |||||||||
| Long Term Growth Rate, % | 2.00 | |||||||||
| Free cash flow (T + 1) | 14,148 | |||||||||
| Terminal Value | 245,028 | |||||||||
| Present Terminal Value | 168,516 | |||||||||
| Enterprise Value | 228,405 | |||||||||
| Net Debt | 14,270 | |||||||||
| Equity Value | 214,135 | |||||||||
| Diluted Shares Outstanding, MM | 782 | |||||||||
| Equity Value Per Share | 273.93 |
What You Will Receive
- Authentic Redington Data: Preloaded financials – including revenue and EBIT – drawn from actual and projected figures.
- Comprehensive Customization: Modify all essential parameters (yellow cells) such as WACC, growth %, and tax rates.
- Immediate Valuation Updates: Automatic recalculations to assess the effects of changes on Redington's fair value.
- Flexible Excel Template: Designed for quick modifications, scenario analysis, and detailed forecasting.
- Efficient and Accurate: Bypass the need to construct models from scratch while ensuring accuracy and adaptability.
Key Features
- Real-Time REDINGTONNS Data: Comes pre-loaded with Redington (India) Limited's historical financials and anticipated future projections.
- Completely Customizable Parameters: Modify inputs such as revenue growth, profit margins, weighted average cost of capital (WACC), tax rates, and capital expenditures.
- Interactive Valuation Model: Automatically refreshes Net Present Value (NPV) and intrinsic value based on your specified inputs.
- Scenario Analysis: Develop various forecasting scenarios to evaluate different valuation results.
- Intuitive User Interface: Designed to be straightforward and accessible for both experts and novices.
How It Works
- Step 1: Download the Excel file.
- Step 2: Review the pre-filled data for Redington (India) Limited (REDINGTONNS) including historical and projected figures.
- Step 3: Modify key assumptions (highlighted in yellow) according to your analysis.
- Step 4: Observe the automatic updates for Redington (India) Limited's (REDINGTONNS) intrinsic value.
- Step 5: Utilize the results for your investment strategies or reports.
Why Opt for Redington (India) Limited (REDINGTONNS) Calculator?
- Precision: Utilizes authentic Redington financial data for reliable results.
- Versatility: Crafted to allow users to easily test and adjust inputs as needed.
- Efficiency: Eliminate the need to construct a DCF model from the ground up.
- High-Caliber: Engineered with a focus on CFO-level accuracy and functionality.
- Accessible: Intuitive design ensures ease of use, even for those without extensive financial modeling knowledge.
Who Should Utilize This Product?
- Individual Investors: Make informed choices regarding the purchase or sale of Redington (REDINGTONNS) shares.
- Financial Analysts: Enhance valuation processes with ready-to-implement financial models specific to Redington (REDINGTONNS).
- Consultants: Provide clients with prompt and precise valuation insights related to Redington (REDINGTONNS).
- Business Owners: Gain insights into the valuation of large companies like Redington (REDINGTONNS) to refine your own business strategies.
- Finance Students: Explore valuation methodologies with real-world data and case studies involving Redington (REDINGTONNS).
Components of the Template
- Historical Data: Contains past financial information and baseline forecasts for Redington (India) Limited (REDINGTONNS).
- DCF and Levered DCF Models: Comprehensive templates designed for calculating the intrinsic value of Redington (India) Limited (REDINGTONNS).
- WACC Sheet: Pre-constructed calculations for the Weighted Average Cost of Capital.
- Editable Inputs: Customize essential drivers such as growth rates, EBITDA percentages, and CAPEX assumptions.
- Quarterly and Annual Statements: A thorough overview of Redington (India) Limited (REDINGTONNS) financials.
- Interactive Dashboard: Dynamic visualization of valuation results and future projections.
Disclaimer
All information, articles, and product details provided on this website are for general informational and educational purposes only. We do not claim any ownership over, nor do we intend to infringe upon, any trademarks, copyrights, logos, brand names, or other intellectual property mentioned or depicted on this site. Such intellectual property remains the property of its respective owners, and any references here are made solely for identification or informational purposes, without implying any affiliation, endorsement, or partnership.
We make no representations or warranties, express or implied, regarding the accuracy, completeness, or suitability of any content or products presented. Nothing on this website should be construed as legal, tax, investment, financial, medical, or other professional advice. In addition, no part of this site—including articles or product references—constitutes a solicitation, recommendation, endorsement, advertisement, or offer to buy or sell any securities, franchises, or other financial instruments, particularly in jurisdictions where such activity would be unlawful.
All content is of a general nature and may not address the specific circumstances of any individual or entity. It is not a substitute for professional advice or services. Any actions you take based on the information provided here are strictly at your own risk. You accept full responsibility for any decisions or outcomes arising from your use of this website and agree to release us from any liability in connection with your use of, or reliance upon, the content or products found herein.