
|
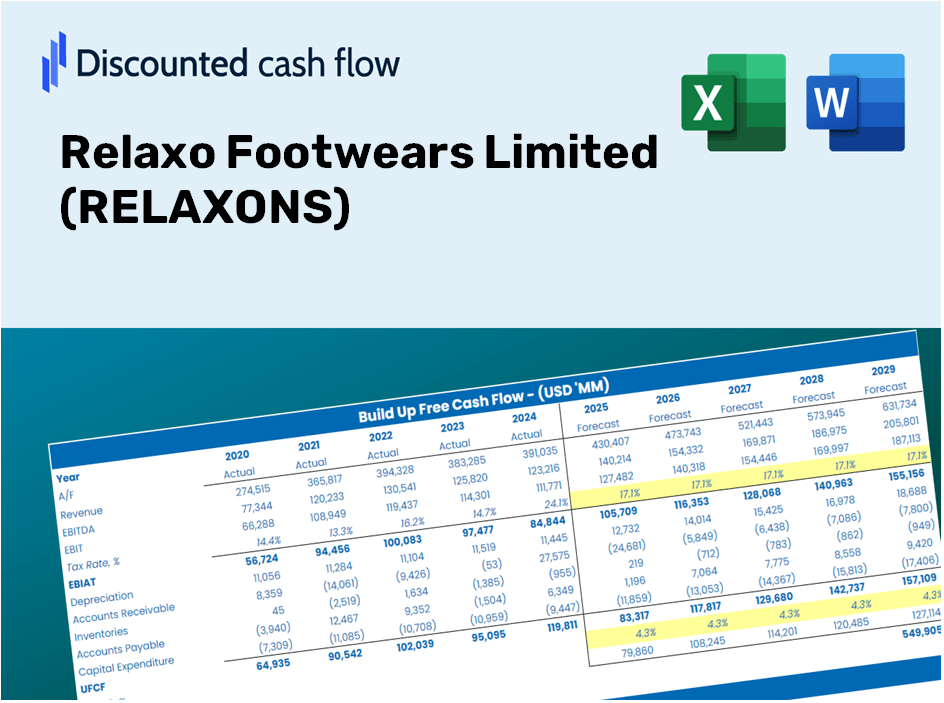
Relaxo Footwears Limited (Relaxo.NS) DCF -Bewertung |
Fully Editable: Tailor To Your Needs In Excel Or Sheets
Professional Design: Trusted, Industry-Standard Templates
Investor-Approved Valuation Models
MAC/PC Compatible, Fully Unlocked
No Expertise Is Needed; Easy To Follow
Relaxo Footwears Limited (RELAXO.NS) Bundle
Bewerten Sie die finanziellen Aussichten von Relaxo Footwears Limited (Relaxons) wie ein Experte! Dieser (Relaxons) DCF-Taschenrechner bietet Ihnen vorgefüllte Finanzdaten und die Flexibilität, wichtige Annahmen wie Umsatzwachstum, WACC, Margen und vieles mehr zu ändern, um sich an Ihren Projektionen anzupassen.
What You Will Receive
- Accurate RELAXONS Financial Data: Pre-loaded with Relaxo Footwears Limited’s historical and forecasted financial figures for in-depth analysis.
- Completely Customizable Template: Easily adjust key parameters such as revenue growth, WACC, and EBITDA percentage.
- Real-Time Calculations: Instantly view updates to Relaxo Footwears Limited’s intrinsic value as you make adjustments.
- Expert Valuation Tool: Tailored for investors, analysts, and consultants aiming for precise DCF outcomes.
- Intuitive Design: User-friendly layout and straightforward guidance suitable for all skill levels.
Key Features
- Customizable Forecast Inputs: Adjust essential variables such as revenue growth, EBITDA margin, and capital expenditures with ease.
- Instant DCF Valuation: Delivers immediate calculations of intrinsic value, NPV, and other metrics.
- High-Precision Accuracy: Leverages Relaxo Footwears Limited's (RELAXONS) actual financial data for dependable valuation results.
- Simplified Scenario Analysis: Effortlessly explore various assumptions and assess their impacts on outcomes.
- Efficiency Booster: Streamlines the process, removing the necessity to create intricate valuation models from the ground up.
How It Functions
- Step 1: Download the Excel file.
- Step 2: Examine the pre-filled data for Relaxo Footwears Limited (RELAXONS), including historical and forecasted figures.
- Step 3: Modify key assumptions (highlighted in yellow) based on your insights.
- Step 4: Observe the automatic updates for the intrinsic value of Relaxo Footwears Limited (RELAXONS).
- Step 5: Utilize the results for making investment choices or for reporting purposes.
Why Opt for This Calculator?
- Reliable Data: Utilize authentic Relaxo Footwears Limited (RELAXONS) financials for trustworthy valuation outcomes.
- Tailorable: Modify essential factors such as growth projections, WACC, and tax rates to align with your own estimates.
- Efficient: Pre-configured calculations save you the hassle of starting from the ground up.
- Professional Tool: Crafted for investors, analysts, and consultants in the industry.
- Easy to Use: User-friendly design and clear, step-by-step guidance make it accessible for everyone.
Who Can Benefit from Relaxo Footwears Limited (RELAXONS)?
- Investors: Evaluate the valuation of Relaxo Footwears Limited (RELAXONS) before making stock transactions.
- CFOs and Financial Analysts: Optimize valuation workflows and assess financial projections.
- Startup Founders: Understand how leading footwear companies like Relaxo are valued in the market.
- Consultants: Create detailed valuation reports for clients focusing on footwear and retail sectors.
- Students and Educators: Utilize real market data to practice and teach valuation methodologies.
Contents of the Template
- Pre-Filled DCF Model: Relaxo Footwears Limited’s (RELAXONS) financial data ready for instant application.
- WACC Calculator: Comprehensive calculations for the Weighted Average Cost of Capital.
- Financial Ratios: Assess Relaxo’s (RELAXONS) profitability, leverage, and operational efficiency.
- Editable Inputs: Modify parameters such as growth rates, profit margins, and CAPEX to align with your scenarios.
- Financial Statements: Access to annual and quarterly reports for thorough analysis.
- Interactive Dashboard: Effortlessly visualize essential valuation metrics and outcomes.
Disclaimer
All information, articles, and product details provided on this website are for general informational and educational purposes only. We do not claim any ownership over, nor do we intend to infringe upon, any trademarks, copyrights, logos, brand names, or other intellectual property mentioned or depicted on this site. Such intellectual property remains the property of its respective owners, and any references here are made solely for identification or informational purposes, without implying any affiliation, endorsement, or partnership.
We make no representations or warranties, express or implied, regarding the accuracy, completeness, or suitability of any content or products presented. Nothing on this website should be construed as legal, tax, investment, financial, medical, or other professional advice. In addition, no part of this site—including articles or product references—constitutes a solicitation, recommendation, endorsement, advertisement, or offer to buy or sell any securities, franchises, or other financial instruments, particularly in jurisdictions where such activity would be unlawful.
All content is of a general nature and may not address the specific circumstances of any individual or entity. It is not a substitute for professional advice or services. Any actions you take based on the information provided here are strictly at your own risk. You accept full responsibility for any decisions or outcomes arising from your use of this website and agree to release us from any liability in connection with your use of, or reliance upon, the content or products found herein.