
|
Atrenew Inc. (RERE) DCF -Bewertung |
Fully Editable: Tailor To Your Needs In Excel Or Sheets
Professional Design: Trusted, Industry-Standard Templates
Investor-Approved Valuation Models
MAC/PC Compatible, Fully Unlocked
No Expertise Is Needed; Easy To Follow
ATRenew Inc. (RERE) Bundle
Vereinfachen Sie die Bewertung von Atrenew Inc. (RERE) mit diesem anpassbaren DCF -Taschenrechner! Mit Real Atrenew Inc. (RERE) -Befinanzierungen und einstellbaren Prognoseeingaben können Sie Szenarien testen und Atrenew Inc. (RERE) in Minuten aufdecken.
What You Will Receive
- Comprehensive Financial Model: ATRenew Inc.'s (RERE) actual figures provide an accurate DCF valuation.
- Complete Forecast Control: Modify revenue growth rates, profit margins, WACC, and other essential factors.
- Real-Time Calculations: Automatic updates allow you to view results instantly as adjustments are made.
- Professional-Grade Template: A polished Excel document crafted for high-quality valuation analysis.
- Flexible and Reusable: Designed for adaptability, making it easy to use for in-depth forecasts repeatedly.
Key Features
- 🔍 Real-Life RERE Financials: Pre-filled historical and projected data for ATRenew Inc. (RERE).
- ✏️ Fully Customizable Inputs: Adjust all critical parameters (yellow cells) like WACC, growth %, and tax rates.
- 📊 Professional DCF Valuation: Built-in formulas calculate ATRenew’s intrinsic value using the Discounted Cash Flow method.
- ⚡ Instant Results: Visualize ATRenew’s valuation instantly after making changes.
- Scenario Analysis: Test and compare outcomes for various financial assumptions side-by-side.
How It Works
- Download: Obtain the pre-prepared Excel file featuring ATRenew Inc.'s (RERE) financial data.
- Customize: Modify projections, such as revenue growth, EBITDA %, and WACC.
- Update Automatically: The intrinsic value and NPV calculations refresh in real-time.
- Test Scenarios: Generate various forecasts and instantly compare results.
- Make Decisions: Leverage the valuation outcomes to inform your investment strategy.
Why Choose ATRenew Inc. (RERE) Calculator?
- Save Time: Skip the hassle of building a model from the ground up – it's ready for immediate use.
- Enhance Accuracy: Dependable financial data and calculations minimize valuation errors.
- Completely Customizable: Adjust the model to align with your specific assumptions and forecasts.
- User-Friendly: Intuitive charts and outputs simplify result analysis.
- Endorsed by Professionals: Crafted for experts who prioritize both precision and functionality.
Who Should Use This Product?
- Investors: Accurately estimate ATRenew Inc.'s (RERE) fair value before making investment decisions.
- CFOs: Leverage a professional-grade DCF model for financial reporting and analysis related to ATRenew Inc. (RERE).
- Consultants: Quickly adapt the template for valuation reports tailored to ATRenew Inc. (RERE) for clients.
- Entrepreneurs: Gain insights into financial modeling practices used by industry leaders, including ATRenew Inc. (RERE).
- Educators: Use it as a teaching tool to demonstrate valuation methodologies applicable to ATRenew Inc. (RERE).
What the Template Contains
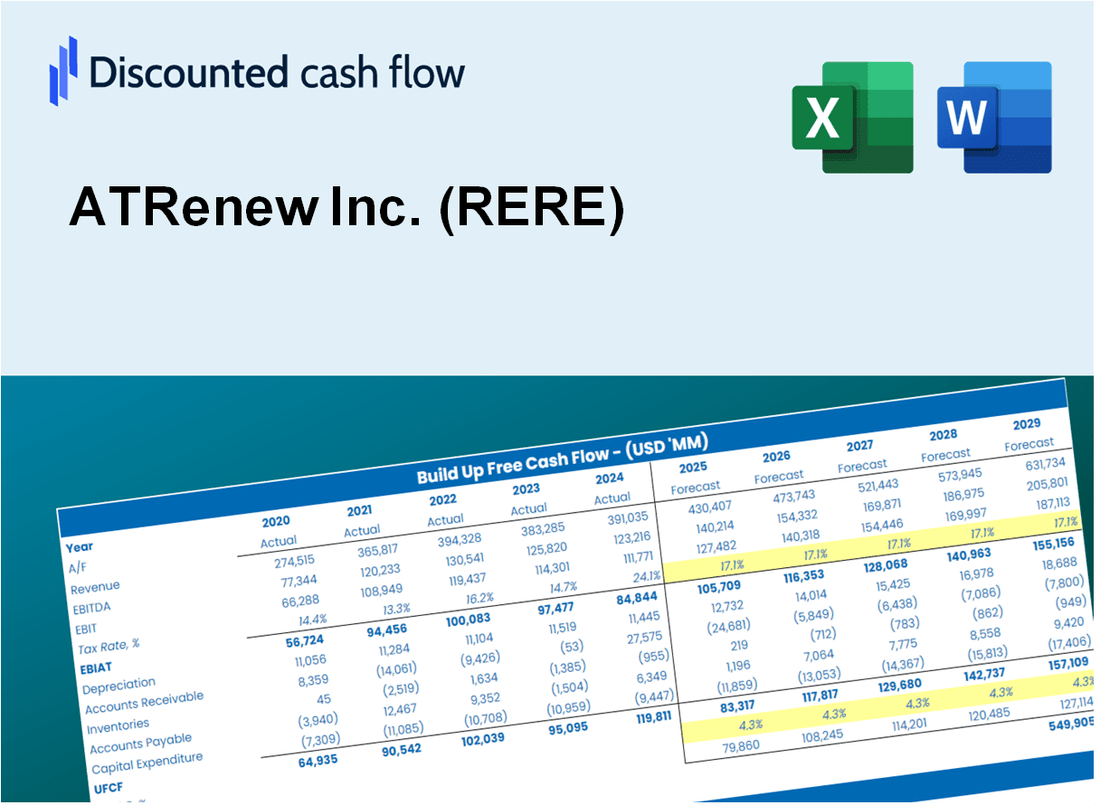
- Operating and Balance Sheet Data: Pre-filled ATRenew Inc. (RERE) historical data and forecasts, including revenue, EBITDA, EBIT, and capital expenditures.
- WACC Calculation: A dedicated sheet for Weighted Average Cost of Capital (WACC), encompassing parameters like Beta, risk-free rate, and share price.
- DCF Valuation (Unlevered and Levered): Editable Discounted Cash Flow models illustrating intrinsic value with comprehensive calculations.
- Financial Statements: Pre-loaded financial statements (annual and quarterly) to facilitate analysis.
- Key Ratios: Includes profitability, leverage, and efficiency ratios for ATRenew Inc. (RERE).
- Dashboard and Charts: Visual summary of valuation outputs and assumptions to simplify results analysis.
Disclaimer
All information, articles, and product details provided on this website are for general informational and educational purposes only. We do not claim any ownership over, nor do we intend to infringe upon, any trademarks, copyrights, logos, brand names, or other intellectual property mentioned or depicted on this site. Such intellectual property remains the property of its respective owners, and any references here are made solely for identification or informational purposes, without implying any affiliation, endorsement, or partnership.
We make no representations or warranties, express or implied, regarding the accuracy, completeness, or suitability of any content or products presented. Nothing on this website should be construed as legal, tax, investment, financial, medical, or other professional advice. In addition, no part of this site—including articles or product references—constitutes a solicitation, recommendation, endorsement, advertisement, or offer to buy or sell any securities, franchises, or other financial instruments, particularly in jurisdictions where such activity would be unlawful.
All content is of a general nature and may not address the specific circumstances of any individual or entity. It is not a substitute for professional advice or services. Any actions you take based on the information provided here are strictly at your own risk. You accept full responsibility for any decisions or outcomes arising from your use of this website and agree to release us from any liability in connection with your use of, or reliance upon, the content or products found herein.