
|
Rev. Group, Inc. (REVG) DCF -Bewertung |
Fully Editable: Tailor To Your Needs In Excel Or Sheets
Professional Design: Trusted, Industry-Standard Templates
Investor-Approved Valuation Models
MAC/PC Compatible, Fully Unlocked
No Expertise Is Needed; Easy To Follow
REV Group, Inc. (REVG) Bundle
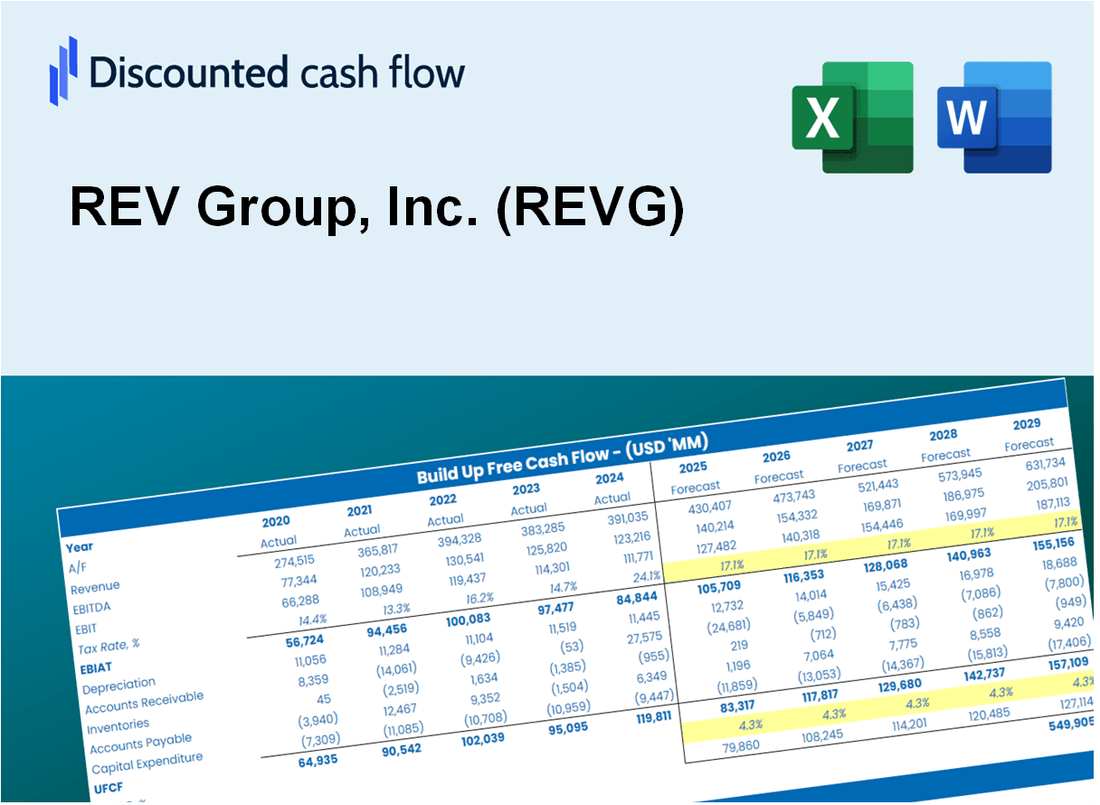
Gewinnen Sie Einblicke in Ihre RevG-Bewertungsanalyse in Ihrer Rev. Group, Inc. (REVG) unter Verwendung unseres hochmodernen DCF-Taschenrechners! Mit dieser Excel -Vorlage können Sie vorgeladene reale RevG -Daten enthalten und ermöglicht es Ihnen, Prognosen und Annahmen anzupassen, um den inneren Wert von Rev. Group, Inc. genau zu bestimmen.
Discounted Cash Flow (DCF) - (USD MM)
| Year | AY1 2020 |
AY2 2021 |
AY3 2022 |
AY4 2023 |
AY5 2024 |
FY1 2025 |
FY2 2026 |
FY3 2027 |
FY4 2028 |
FY5 2029 |
|---|---|---|---|---|---|---|---|---|---|---|
| Revenue | 2,277.6 | 2,380.8 | 2,331.6 | 2,638.0 | 2,380.2 | 2,414.9 | 2,450.1 | 2,485.9 | 2,522.1 | 2,558.9 |
| Revenue Growth, % | 0 | 4.53 | -2.07 | 13.14 | -9.77 | 1.46 | 1.46 | 1.46 | 1.46 | 1.46 |
| EBITDA | 19.8 | 120.1 | 69.0 | 113.0 | 394.3 | 143.6 | 145.6 | 147.8 | 149.9 | 152.1 |
| EBITDA, % | 0.86934 | 5.04 | 2.96 | 4.28 | 16.57 | 5.94 | 5.94 | 5.94 | 5.94 | 5.94 |
| Depreciation | 40.2 | 32.0 | 32.3 | 26.2 | 25.4 | 31.7 | 32.1 | 32.6 | 33.1 | 33.5 |
| Depreciation, % | 1.77 | 1.34 | 1.39 | 0.99318 | 1.07 | 1.31 | 1.31 | 1.31 | 1.31 | 1.31 |
| EBIT | -20.4 | 88.1 | 36.7 | 86.8 | 368.9 | 111.9 | 113.5 | 115.2 | 116.9 | 118.6 |
| EBIT, % | -0.89568 | 3.7 | 1.57 | 3.29 | 15.5 | 4.63 | 4.63 | 4.63 | 4.63 | 4.63 |
| Total Cash | 11.4 | 13.3 | 20.4 | 21.3 | 24.6 | 18.2 | 18.5 | 18.8 | 19.0 | 19.3 |
| Total Cash, percent | .0 | .0 | .0 | .0 | .0 | .0 | .0 | .0 | .0 | .0 |
| Account Receivables | 229.3 | 248.4 | 215.0 | 226.5 | 152.3 | 215.9 | 219.1 | 222.3 | 225.5 | 228.8 |
| Account Receivables, % | 10.07 | 10.43 | 9.22 | 8.59 | 6.4 | 8.94 | 8.94 | 8.94 | 8.94 | 8.94 |
| Inventories | 537.2 | 481.7 | 629.5 | 657.7 | 602.8 | 584.8 | 593.3 | 601.9 | 610.7 | 619.6 |
| Inventories, % | 23.59 | 20.23 | 27 | 24.93 | 25.33 | 24.21 | 24.21 | 24.21 | 24.21 | 24.21 |
| Accounts Payable | 169.5 | 116.2 | 163.9 | 208.3 | 188.8 | 169.9 | 172.4 | 174.9 | 177.5 | 180.0 |
| Accounts Payable, % | 7.44 | 4.88 | 7.03 | 7.9 | 7.93 | 7.04 | 7.04 | 7.04 | 7.04 | 7.04 |
| Capital Expenditure | -16.8 | -24.7 | -24.8 | -32.8 | -27.6 | -25.3 | -25.7 | -26.1 | -26.4 | -26.8 |
| Capital Expenditure, % | -0.73762 | -1.04 | -1.06 | -1.24 | -1.16 | -1.05 | -1.05 | -1.05 | -1.05 | -1.05 |
| Tax Rate, % | 24.32 | 24.32 | 24.32 | 24.32 | 24.32 | 24.32 | 24.32 | 24.32 | 24.32 | 24.32 |
| EBITAT | -13.5 | 70.2 | 28.2 | 67.6 | 279.2 | 84.2 | 85.4 | 86.7 | 87.9 | 89.2 |
| Depreciation | ||||||||||
| Changes in Account Receivables | ||||||||||
| Changes in Inventories | ||||||||||
| Changes in Accounts Payable | ||||||||||
| Capital Expenditure | ||||||||||
| UFCF | -587.1 | 60.6 | -31.0 | 65.7 | 386.6 | 26.0 | 82.6 | 83.8 | 85.1 | 86.3 |
| WACC, % | 9.28 | 9.4 | 9.37 | 9.38 | 9.36 | 9.36 | 9.36 | 9.36 | 9.36 | 9.36 |
| PV UFCF | ||||||||||
| SUM PV UFCF | 271.7 | |||||||||
| Long Term Growth Rate, % | 3.50 | |||||||||
| Free cash flow (T + 1) | 89 | |||||||||
| Terminal Value | 1,524 | |||||||||
| Present Terminal Value | 974 | |||||||||
| Enterprise Value | 1,246 | |||||||||
| Net Debt | 93 | |||||||||
| Equity Value | 1,153 | |||||||||
| Diluted Shares Outstanding, MM | 55 | |||||||||
| Equity Value Per Share | 21.10 |
What You Will Get
- Real REV Group Data: Preloaded financials – from revenue to EBIT – based on actual and projected figures for REV Group, Inc. (REVG).
- Full Customization: Adjust all critical parameters (yellow cells) like WACC, growth %, and tax rates to fit your analysis.
- Instant Valuation Updates: Automatic recalculations to analyze the impact of changes on REV Group’s fair value.
- Versatile Excel Template: Designed for quick edits, scenario testing, and detailed projections specific to REV Group, Inc. (REVG).
- Time-Saving and Accurate: Eliminate the need to build models from scratch while ensuring precision and flexibility.
Key Features
- Customizable Financial Inputs: Adjust essential parameters such as revenue projections, EBITDA margins, and capital investments.
- Instant DCF Valuation: Automatically computes intrinsic value, NPV, and various financial metrics in real-time.
- High-Precision Accuracy: Leverages REV Group's actual financial data for dependable valuation results.
- Effortless Scenario Testing: Explore various assumptions and analyze different outcomes with ease.
- Efficiency Booster: Remove the hassle of creating intricate valuation models from the ground up.
How It Works
- Step 1: Download the Excel file.
- Step 2: Review pre-entered REV Group, Inc. (REVG) data (historical and projected).
- Step 3: Adjust key assumptions (yellow cells) based on your analysis.
- Step 4: View automatic recalculations for REV Group, Inc. (REVG) intrinsic value.
- Step 5: Use the outputs for investment decisions or reporting.
Why Choose This Calculator for REV Group, Inc. (REVG)?
- Accuracy: Utilizes real REV Group financial data to ensure precision.
- Flexibility: Allows users to easily test and adjust inputs as needed.
- Time-Saving: Avoid the complexities of building a DCF model from the ground up.
- Professional-Grade: Crafted with the expertise and usability expected by CFOs.
- User-Friendly: Designed for ease of use, even for those lacking advanced financial modeling skills.
Who Should Use REV Group, Inc. (REVG)?
- Automotive Students: Explore industry-specific valuation methods and apply them to real-world scenarios.
- Researchers: Utilize advanced models in your academic studies or market analysis.
- Investors: Validate your investment strategies and assess valuation metrics for REV Group, Inc. (REVG).
- Market Analysts: Enhance your analysis process with a customizable financial model tailored for the automotive sector.
- Entrepreneurs: Understand the evaluation techniques used for large public companies like REV Group, Inc. (REVG).
What the Template Contains
- Operating and Balance Sheet Data: Pre-filled REV Group historical data and forecasts, including revenue, EBITDA, EBIT, and capital expenditures.
- WACC Calculation: A dedicated sheet for Weighted Average Cost of Capital (WACC), including parameters like Beta, risk-free rate, and share price.
- DCF Valuation (Unlevered and Levered): Editable Discounted Cash Flow models showing intrinsic value with detailed calculations.
- Financial Statements: Pre-loaded financial statements (annual and quarterly) to support analysis.
- Key Ratios: Includes profitability, leverage, and efficiency ratios for REV Group, Inc. (REVG).
- Dashboard and Charts: Visual summary of valuation outputs and assumptions to analyze results easily.
Disclaimer
All information, articles, and product details provided on this website are for general informational and educational purposes only. We do not claim any ownership over, nor do we intend to infringe upon, any trademarks, copyrights, logos, brand names, or other intellectual property mentioned or depicted on this site. Such intellectual property remains the property of its respective owners, and any references here are made solely for identification or informational purposes, without implying any affiliation, endorsement, or partnership.
We make no representations or warranties, express or implied, regarding the accuracy, completeness, or suitability of any content or products presented. Nothing on this website should be construed as legal, tax, investment, financial, medical, or other professional advice. In addition, no part of this site—including articles or product references—constitutes a solicitation, recommendation, endorsement, advertisement, or offer to buy or sell any securities, franchises, or other financial instruments, particularly in jurisdictions where such activity would be unlawful.
All content is of a general nature and may not address the specific circumstances of any individual or entity. It is not a substitute for professional advice or services. Any actions you take based on the information provided here are strictly at your own risk. You accept full responsibility for any decisions or outcomes arising from your use of this website and agree to release us from any liability in connection with your use of, or reliance upon, the content or products found herein.