
|
RE/Max Holdings, Inc. (RMAX) DCF -Bewertung |
Fully Editable: Tailor To Your Needs In Excel Or Sheets
Professional Design: Trusted, Industry-Standard Templates
Investor-Approved Valuation Models
MAC/PC Compatible, Fully Unlocked
No Expertise Is Needed; Easy To Follow
RE/MAX Holdings, Inc. (RMAX) Bundle
Als Anleger oder Analyst ist der DCF-Taschenrechner von RE/Max Holdings, Inc. (RMAX) Ihr Anlaufwerk für eine genaue Bewertung. Ausgestattet mit echten Daten von Re/Max Holdings können Sie Prognosen anpassen und die Auswirkungen in Echtzeit beobachten.
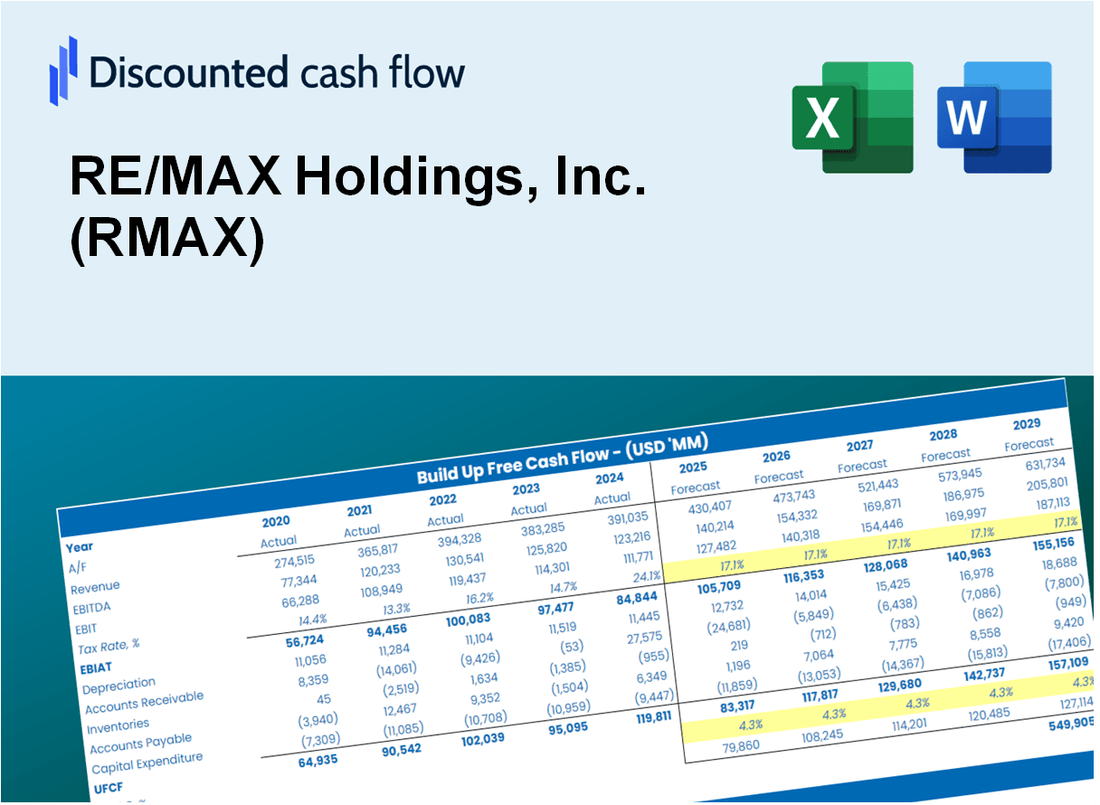
Discounted Cash Flow (DCF) - (USD MM)
| Year | AY1 2020 |
AY2 2021 |
AY3 2022 |
AY4 2023 |
AY5 2024 |
FY1 2025 |
FY2 2026 |
FY3 2027 |
FY4 2028 |
FY5 2029 |
|---|---|---|---|---|---|---|---|---|---|---|
| Revenue | 266.0 | 329.7 | 353.4 | 325.7 | 307.7 | 321.4 | 335.6 | 350.5 | 366.1 | 382.4 |
| Revenue Growth, % | 0 | 23.95 | 7.18 | -7.84 | -5.52 | 4.44 | 4.44 | 4.44 | 4.44 | 4.44 |
| EBITDA | 72.6 | 67.4 | 87.3 | 26.6 | 75.2 | 67.5 | 70.5 | 73.7 | 76.9 | 80.4 |
| EBITDA, % | 27.29 | 20.45 | 24.71 | 8.17 | 24.45 | 21.02 | 21.02 | 21.02 | 21.02 | 21.02 |
| Depreciation | 26.1 | 31.3 | 35.8 | 32.4 | 29.6 | 31.5 | 32.9 | 34.4 | 35.9 | 37.5 |
| Depreciation, % | 9.81 | 9.5 | 10.12 | 9.95 | 9.61 | 9.8 | 9.8 | 9.8 | 9.8 | 9.8 |
| EBIT | 46.5 | 36.1 | 51.6 | -5.8 | 45.7 | 36.0 | 37.6 | 39.3 | 41.1 | 42.9 |
| EBIT, % | 17.48 | 10.95 | 14.59 | -1.78 | 14.84 | 11.22 | 11.22 | 11.22 | 11.22 | 11.22 |
| Total Cash | 101.4 | 126.3 | 108.7 | 82.6 | 96.6 | 105.4 | 110.0 | 114.9 | 120.0 | 125.4 |
| Total Cash, percent | .0 | .0 | .0 | .0 | .0 | .0 | .0 | .0 | .0 | .0 |
| Account Receivables | 30.0 | 34.6 | 32.5 | 35.1 | 35.4 | 34.2 | 35.8 | 37.3 | 39.0 | 40.7 |
| Account Receivables, % | 11.27 | 10.5 | 9.2 | 10.79 | 11.5 | 10.65 | 10.65 | 10.65 | 10.65 | 10.65 |
| Inventories | 19.9 | 32.1 | 29.5 | .0 | .0 | 16.4 | 17.2 | 17.9 | 18.7 | 19.5 |
| Inventories, % | 7.47 | 9.74 | 8.34 | 0 | 0 | 5.11 | 5.11 | 5.11 | 5.11 | 5.11 |
| Accounts Payable | 2.1 | 5.2 | 6.2 | 4.7 | 5.8 | 4.8 | 5.0 | 5.2 | 5.4 | 5.7 |
| Accounts Payable, % | 0.79248 | 1.57 | 1.74 | 1.44 | 1.87 | 1.49 | 1.49 | 1.49 | 1.49 | 1.49 |
| Capital Expenditure | -6.9 | -15.2 | -9.9 | -6.4 | -6.6 | -9.1 | -9.5 | -9.9 | -10.4 | -10.8 |
| Capital Expenditure, % | -2.6 | -4.62 | -2.81 | -1.97 | -2.15 | -2.83 | -2.83 | -2.83 | -2.83 | -2.83 |
| Tax Rate, % | -14.89 | -14.89 | -14.89 | -14.89 | -14.89 | -14.89 | -14.89 | -14.89 | -14.89 | -14.89 |
| EBITAT | 17.6 | 25.4 | 17.4 | -9.6 | 52.5 | 24.7 | 25.8 | 26.9 | 28.1 | 29.3 |
| Depreciation | ||||||||||
| Changes in Account Receivables | ||||||||||
| Changes in Inventories | ||||||||||
| Changes in Accounts Payable | ||||||||||
| Capital Expenditure | ||||||||||
| UFCF | -10.9 | 27.7 | 48.9 | 41.7 | 76.2 | 30.8 | 47.1 | 49.2 | 51.4 | 53.7 |
| WACC, % | 4.53 | 6.44 | 4.28 | 8.17 | 8.17 | 6.32 | 6.32 | 6.32 | 6.32 | 6.32 |
| PV UFCF | ||||||||||
| SUM PV UFCF | 191.3 | |||||||||
| Long Term Growth Rate, % | 3.70 | |||||||||
| Free cash flow (T + 1) | 56 | |||||||||
| Terminal Value | 2,124 | |||||||||
| Present Terminal Value | 1,564 | |||||||||
| Enterprise Value | 1,755 | |||||||||
| Net Debt | 375 | |||||||||
| Equity Value | 1,380 | |||||||||
| Diluted Shares Outstanding, MM | 19 | |||||||||
| Equity Value Per Share | 71.50 |
What You Will Get
- Pre-Filled Financial Model: RE/MAX Holdings, Inc.'s actual data allows for accurate DCF valuation.
- Full Forecast Control: Modify revenue growth, profit margins, WACC, and other essential drivers.
- Instant Calculations: Real-time updates ensure you see the impact of your adjustments immediately.
- Investor-Ready Template: A polished Excel file crafted for professional-level valuation.
- Customizable and Reusable: Designed for adaptability, enabling repeated use for in-depth forecasts.
Key Features
- Customizable Market Assumptions: Adjust key factors such as commission rates, market growth, and operational expenses.
- Instant Valuation Calculations: Quickly determines intrinsic value, NPV, and other financial metrics.
- Industry-Leading Precision: Based on RE/MAX’s actual financial data for accurate valuation results.
- Effortless Scenario Testing: Easily evaluate various scenarios and analyze their impacts on outcomes.
- Efficiency Boost: Avoid the complexity of constructing detailed valuation models from the ground up.
How It Works
- Step 1: Download the prebuilt Excel template featuring RE/MAX Holdings, Inc. (RMAX) data.
- Step 2: Review the pre-filled sheets to grasp the essential metrics.
- Step 3: Modify forecasts and assumptions in the editable yellow cells (WACC, growth, margins).
- Step 4: Instantly see the recalculated results, including RE/MAX Holdings, Inc.'s (RMAX) intrinsic value.
- Step 5: Use the outputs to make informed investment decisions or create reports.
Why Choose This Calculator for RE/MAX Holdings, Inc. (RMAX)?
- All-in-One Solution: Combines DCF, WACC, and financial ratio analyses tailored for RE/MAX Holdings.
- Flexible Inputs: Modify the highlighted cells to explore different financial scenarios for (RMAX).
- In-Depth Analysis: Automatically computes the intrinsic value and Net Present Value specific to RE/MAX Holdings.
- Ready-to-Use Data: Incorporates historical and projected data for reliable analysis starting points.
- High-Quality Standards: Perfect for financial analysts, investors, and consultants focusing on RE/MAX Holdings, Inc.
Who Should Use This Product?
- Real Estate Professionals: Enhance property valuation techniques for better market analysis.
- Corporate Real Estate Teams: Evaluate property scenarios to inform strategic decisions.
- Consultants and Advisors: Offer clients precise valuation insights for RE/MAX Holdings, Inc. (RMAX) stock.
- Students and Educators: Utilize real estate data to learn and teach financial modeling principles.
- Market Analysts: Gain insights into how real estate companies like RE/MAX are valued in the industry.
What the Template Contains
- Operating and Balance Sheet Data: Pre-filled RE/MAX Holdings, Inc. (RMAX) historical data and forecasts, including revenue, EBITDA, EBIT, and capital expenditures.
- WACC Calculation: A dedicated sheet for Weighted Average Cost of Capital (WACC), featuring parameters like Beta, risk-free rate, and share price.
- DCF Valuation (Unlevered and Levered): Editable Discounted Cash Flow models that display intrinsic value with comprehensive calculations.
- Financial Statements: Pre-loaded financial statements (annual and quarterly) to facilitate analysis.
- Key Ratios: Includes profitability, leverage, and efficiency ratios for RE/MAX Holdings, Inc. (RMAX).
- Dashboard and Charts: Visual summary of valuation outputs and assumptions to simplify the analysis of results.
Disclaimer
All information, articles, and product details provided on this website are for general informational and educational purposes only. We do not claim any ownership over, nor do we intend to infringe upon, any trademarks, copyrights, logos, brand names, or other intellectual property mentioned or depicted on this site. Such intellectual property remains the property of its respective owners, and any references here are made solely for identification or informational purposes, without implying any affiliation, endorsement, or partnership.
We make no representations or warranties, express or implied, regarding the accuracy, completeness, or suitability of any content or products presented. Nothing on this website should be construed as legal, tax, investment, financial, medical, or other professional advice. In addition, no part of this site—including articles or product references—constitutes a solicitation, recommendation, endorsement, advertisement, or offer to buy or sell any securities, franchises, or other financial instruments, particularly in jurisdictions where such activity would be unlawful.
All content is of a general nature and may not address the specific circumstances of any individual or entity. It is not a substitute for professional advice or services. Any actions you take based on the information provided here are strictly at your own risk. You accept full responsibility for any decisions or outcomes arising from your use of this website and agree to release us from any liability in connection with your use of, or reliance upon, the content or products found herein.