
|
Renasant Corporation (RNST) DCF -Bewertung |
Fully Editable: Tailor To Your Needs In Excel Or Sheets
Professional Design: Trusted, Industry-Standard Templates
Investor-Approved Valuation Models
MAC/PC Compatible, Fully Unlocked
No Expertise Is Needed; Easy To Follow
Renasant Corporation (RNST) Bundle
Verbessern Sie Ihre Anlagestrategien mit dem DCF -Taschenrechner der Renasant Corporation (RNST)! Untersuchen Sie authentische renasante Finanzdaten, passen Sie Wachstumsprojektionen und -kosten an und beobachten Sie sofort, wie sich diese Veränderungen auf den inneren Wert von RNST auswirken.
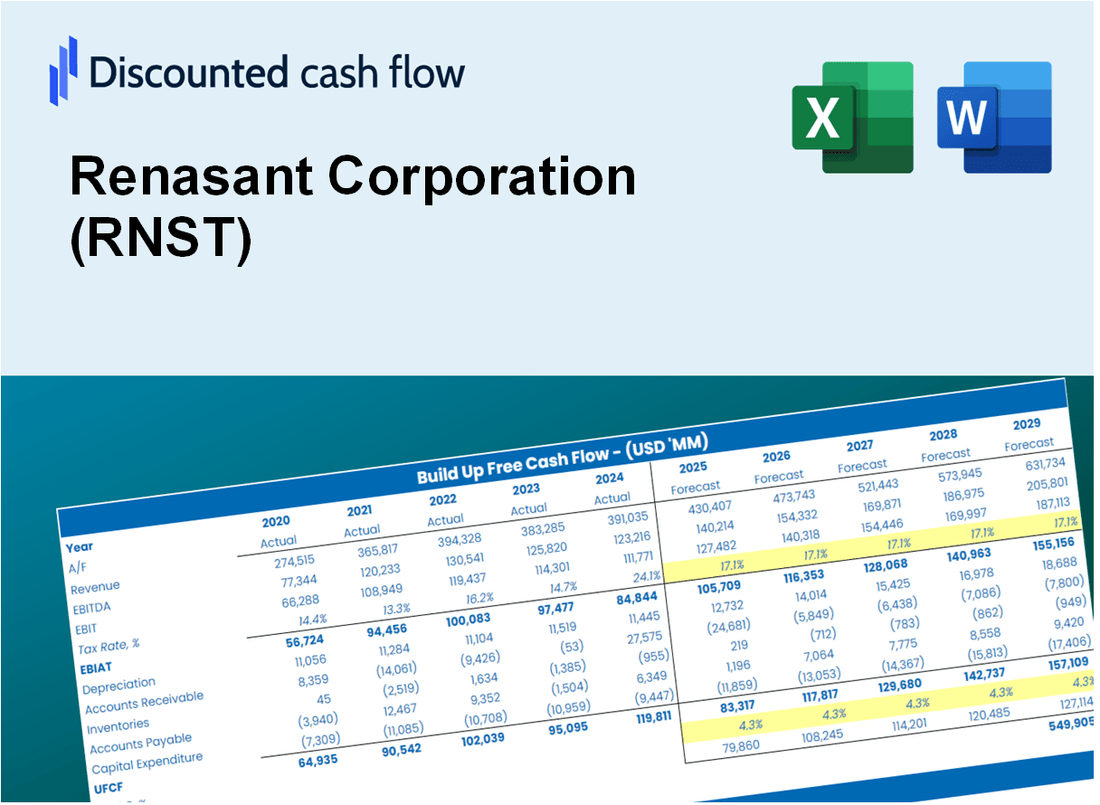
Discounted Cash Flow (DCF) - (USD MM)
| Year | AY1 2020 |
AY2 2021 |
AY3 2022 |
AY4 2023 |
AY5 2024 |
FY1 2025 |
FY2 2026 |
FY3 2027 |
FY4 2028 |
FY5 2029 |
|---|---|---|---|---|---|---|---|---|---|---|
| Revenue | 731.6 | 695.7 | 691.1 | 909.8 | 1,038.0 | 1,142.3 | 1,257.0 | 1,383.2 | 1,522.1 | 1,675.0 |
| Revenue Growth, % | 0 | -4.91 | -0.6621 | 31.65 | 14.1 | 10.04 | 10.04 | 10.04 | 10.04 | 10.04 |
| EBITDA | 138.1 | 270.2 | 254.1 | 212.4 | 277.2 | 330.2 | 363.4 | 399.9 | 440.0 | 484.2 |
| EBITDA, % | 18.88 | 38.84 | 36.76 | 23.35 | 26.71 | 28.91 | 28.91 | 28.91 | 28.91 | 28.91 |
| Depreciation | 34.6 | 47.4 | 42.7 | 35.2 | 32.3 | 56.4 | 62.1 | 68.4 | 75.2 | 82.8 |
| Depreciation, % | 4.73 | 6.81 | 6.19 | 3.87 | 3.11 | 4.94 | 4.94 | 4.94 | 4.94 | 4.94 |
| EBIT | 103.5 | 222.8 | 211.3 | 177.2 | 245.0 | 273.8 | 301.2 | 331.5 | 364.8 | 401.4 |
| EBIT, % | 14.15 | 32.03 | 30.58 | 19.48 | 23.6 | 23.97 | 23.97 | 23.97 | 23.97 | 23.97 |
| Total Cash | 1,976.7 | 4,264.0 | 2,109.9 | 1,724.6 | 1,923.0 | 1,142.3 | 1,257.0 | 1,383.2 | 1,522.1 | 1,675.0 |
| Total Cash, percent | .0 | .0 | .0 | .0 | .0 | .0 | .0 | .0 | .0 | .0 |
| Account Receivables | 74.2 | 74.6 | 112.6 | 113.5 | 87.2 | 132.6 | 145.9 | 160.6 | 176.7 | 194.4 |
| Account Receivables, % | 10.15 | 10.73 | 16.29 | 12.48 | 8.4 | 11.61 | 11.61 | 11.61 | 11.61 | 11.61 |
| Inventories | .0 | .0 | .0 | .0 | .0 | .0 | .0 | .0 | .0 | .0 |
| Inventories, % | 0 | 0 | 0 | 0 | 0 | 0 | 0 | 0 | 0 | 0 |
| Accounts Payable | .0 | .0 | .0 | .0 | .0 | .0 | .0 | .0 | .0 | .0 |
| Accounts Payable, % | 0 | 0 | 0 | 0 | 0 | 0 | 0 | 0 | 0 | 0 |
| Capital Expenditure | -28.3 | -20.5 | -14.8 | -21.6 | -13.6 | -28.9 | -31.8 | -35.0 | -38.5 | -42.4 |
| Capital Expenditure, % | -3.86 | -2.95 | -2.15 | -2.38 | -1.31 | -2.53 | -2.53 | -2.53 | -2.53 | -2.53 |
| Tax Rate, % | 20.21 | 20.21 | 20.21 | 20.21 | 20.21 | 20.21 | 20.21 | 20.21 | 20.21 | 20.21 |
| EBITAT | 83.7 | 175.9 | 166.1 | 144.7 | 195.5 | 218.9 | 240.9 | 265.1 | 291.7 | 321.0 |
| Depreciation | ||||||||||
| Changes in Account Receivables | ||||||||||
| Changes in Inventories | ||||||||||
| Changes in Accounts Payable | ||||||||||
| Capital Expenditure | ||||||||||
| UFCF | 15.8 | 202.3 | 156.1 | 157.3 | 240.4 | 201.1 | 257.9 | 283.8 | 312.3 | 343.6 |
| WACC, % | 18.37 | 18.09 | 18.04 | 18.48 | 18.22 | 18.24 | 18.24 | 18.24 | 18.24 | 18.24 |
| PV UFCF | ||||||||||
| SUM PV UFCF | 834.6 | |||||||||
| Long Term Growth Rate, % | 2.00 | |||||||||
| Free cash flow (T + 1) | 350 | |||||||||
| Terminal Value | 2,158 | |||||||||
| Present Terminal Value | 934 | |||||||||
| Enterprise Value | 1,768 | |||||||||
| Net Debt | -553 | |||||||||
| Equity Value | 2,322 | |||||||||
| Diluted Shares Outstanding, MM | 60 | |||||||||
| Equity Value Per Share | 38.86 |
What You Will Receive
- Real Renasant Data: Preloaded financials – including revenue and EBIT – derived from actual and projected figures.
- Complete Customization: Modify all essential parameters (yellow cells) such as WACC, growth %, and tax rates.
- Instant Valuation Updates: Automatic recalculations to assess the effects of changes on Renasant’s fair value.
- Flexible Excel Template: Designed for quick edits, scenario analysis, and comprehensive projections.
- Efficient and Accurate: Avoid the hassle of building models from the ground up while ensuring precision and adaptability.
Key Features
- Comprehensive DCF Calculator: Features detailed unlevered and levered DCF valuation models tailored for Renasant Corporation (RNST).
- WACC Calculator: Pre-configured Weighted Average Cost of Capital sheet with adjustable inputs specific to Renasant Corporation (RNST).
- Customizable Forecast Assumptions: Adjust growth rates, capital expenditures, and discount rates according to your analysis for Renasant Corporation (RNST).
- Integrated Financial Ratios: Evaluate profitability, leverage, and efficiency ratios relevant to Renasant Corporation (RNST).
- Interactive Dashboard and Charts: Visual representations summarize essential valuation metrics for straightforward analysis of Renasant Corporation (RNST).
How It Works
- Step 1: Download the prebuilt Excel template containing Renasant Corporation’s data.
- Step 2: Navigate through the pre-filled sheets to familiarize yourself with the essential metrics.
- Step 3: Modify forecasts and assumptions in the editable yellow cells (WACC, growth, margins).
- Step 4: Instantly see the recalculated results, including Renasant Corporation’s intrinsic value.
- Step 5: Utilize the outputs to make informed investment decisions or create reports.
Why Choose This Calculator for Renasant Corporation (RNST)?
- Comprehensive Tool: Incorporates DCF, WACC, and financial ratio analyses tailored for Renasant Corporation.
- Customizable Inputs: Modify the yellow-highlighted cells to explore different financial scenarios.
- Detailed Insights: Automatically computes Renasant Corporation’s intrinsic value and Net Present Value.
- Preloaded Data: Features historical and forecasted data for precise analysis.
- Professional Quality: Perfect for financial analysts, investors, and business consultants focused on Renasant Corporation.
Who Should Use Renasant Corporation (RNST)?
- Investors: Gain insights and make informed investment choices with Renasant Corporation's financial data.
- Financial Analysts: Utilize comprehensive reports to streamline your analysis and reporting process.
- Consultants: Tailor Renasant's financial information for impactful client presentations and strategic advice.
- Finance Enthusiasts: Enhance your knowledge of banking and financial services through Renasant's performance metrics.
- Educators and Students: Leverage Renasant's resources as a practical case study in finance and economics courses.
What the Template Contains
- Pre-Filled Data: Includes Renasant Corporation’s historical financials and forecasts.
- Discounted Cash Flow Model: Editable DCF valuation model with automatic calculations.
- Weighted Average Cost of Capital (WACC): A dedicated sheet for calculating WACC based on custom inputs.
- Key Financial Ratios: Analyze Renasant Corporation’s profitability, efficiency, and leverage.
- Customizable Inputs: Edit revenue growth, margins, and tax rates with ease.
- Clear Dashboard: Charts and tables summarizing key valuation results.
Disclaimer
All information, articles, and product details provided on this website are for general informational and educational purposes only. We do not claim any ownership over, nor do we intend to infringe upon, any trademarks, copyrights, logos, brand names, or other intellectual property mentioned or depicted on this site. Such intellectual property remains the property of its respective owners, and any references here are made solely for identification or informational purposes, without implying any affiliation, endorsement, or partnership.
We make no representations or warranties, express or implied, regarding the accuracy, completeness, or suitability of any content or products presented. Nothing on this website should be construed as legal, tax, investment, financial, medical, or other professional advice. In addition, no part of this site—including articles or product references—constitutes a solicitation, recommendation, endorsement, advertisement, or offer to buy or sell any securities, franchises, or other financial instruments, particularly in jurisdictions where such activity would be unlawful.
All content is of a general nature and may not address the specific circumstances of any individual or entity. It is not a substitute for professional advice or services. Any actions you take based on the information provided here are strictly at your own risk. You accept full responsibility for any decisions or outcomes arising from your use of this website and agree to release us from any liability in connection with your use of, or reliance upon, the content or products found herein.