
|
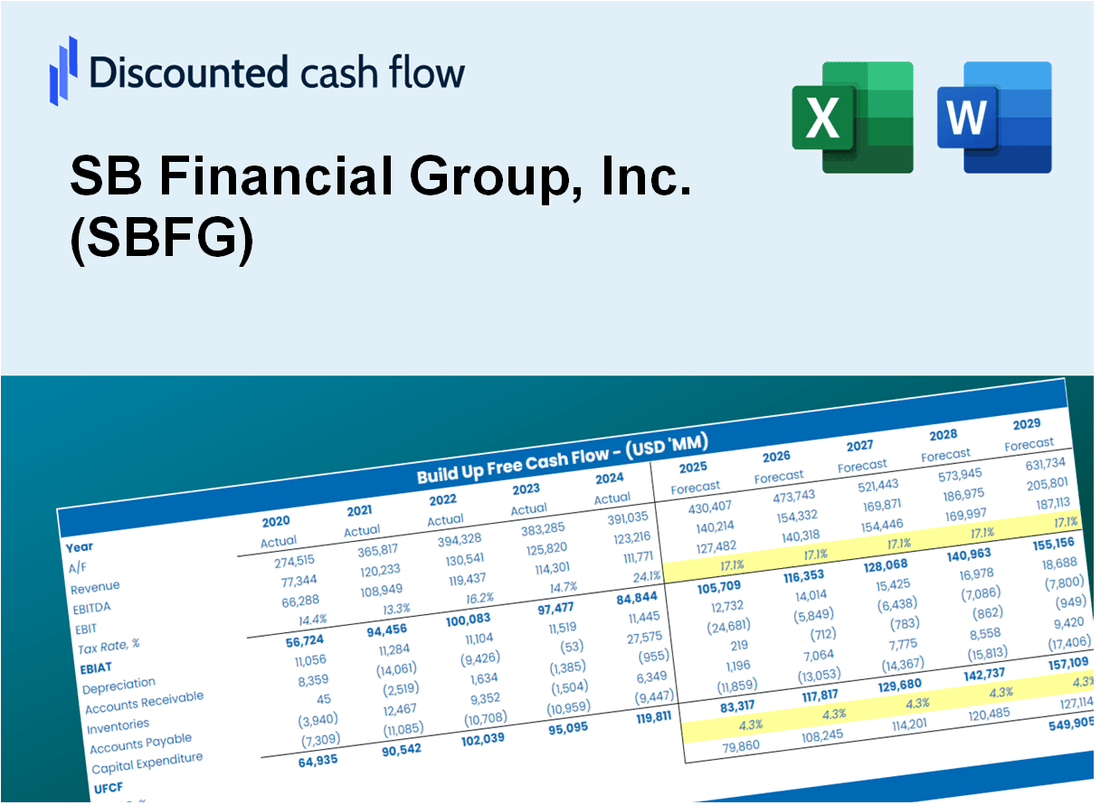
SB Financial Group, Inc. (SBFG) DCF -Bewertung |
Fully Editable: Tailor To Your Needs In Excel Or Sheets
Professional Design: Trusted, Industry-Standard Templates
Investor-Approved Valuation Models
MAC/PC Compatible, Fully Unlocked
No Expertise Is Needed; Easy To Follow
SB Financial Group, Inc. (SBFG) Bundle
Unabhängig davon, ob Sie ein Investor oder Analyst sind, ist dieser (SBFG) DCF -Taschenrechner Ihr wesentliches Werkzeug für eine genaue Bewertung. Mit realen Daten von SB Financial Group, Inc., können Sie Prognosen anpassen und die Ergebnisse sofort sehen.
What You Will Get
- Real SBFG Financials: Access to historical and projected data for precise valuation.
- Customizable Inputs: Adjust WACC, tax rates, revenue growth, and capital expenditures as needed.
- Dynamic Calculations: Intrinsic value and NPV are computed in real-time.
- Scenario Analysis: Explore various scenarios to assess SB Financial Group’s future performance.
- User-Friendly Design: Designed for professionals while remaining approachable for newcomers.
Key Features
- Customizable Financial Inputs: Adjust essential variables such as loan growth, interest rates, and operational expenses.
- Instant Valuation Calculations: Quickly determines the intrinsic value, NPV, and other financial metrics.
- High-Precision Analytics: Leverages SB Financial Group's real-time data for accurate valuation results.
- Effortless Scenario Testing: Easily evaluate various financial scenarios and analyze their impacts.
- Efficiency Booster: Streamline your process by avoiding the complexities of building valuation models from the ground up.
How It Works
- Step 1: Download the Excel file for SB Financial Group, Inc. (SBFG).
- Step 2: Review the pre-entered financial data for SBFG (historical and projected).
- Step 3: Adjust key assumptions (yellow cells) based on your analysis of SBFG.
- Step 4: View automatic recalculations for SBFG’s intrinsic value.
- Step 5: Utilize the outputs for investment decisions or reporting regarding SBFG.
Why Choose SB Financial Group, Inc. (SBFG) Calculator?
- Designed for Experts: A sophisticated tool utilized by financial analysts, investment managers, and advisors.
- Comprehensive Data: SBFG’s past and projected financials integrated for precise analysis.
- Flexible Scenario Analysis: Effortlessly model various forecasts and assumptions.
- Insightful Outputs: Automatically computes intrinsic value, NPV, and essential financial metrics.
- User-Friendly: Detailed instructions walk you through every step of the calculation process.
Who Should Use This Product?
- Investors: Accurately assess SB Financial Group, Inc.'s (SBFG) market potential before making investment choices.
- CFOs: Utilize a sophisticated DCF model for comprehensive financial reporting and analysis.
- Consultants: Efficiently modify the template for valuation reports tailored to client needs.
- Entrepreneurs: Gain valuable insights into the financial modeling practices of leading financial firms.
- Educators: Employ it as an educational resource to illustrate various valuation techniques.
What the Template Contains
- Pre-Filled DCF Model: SB Financial Group, Inc.'s (SBFG) financial data preloaded for immediate use.
- WACC Calculator: Detailed calculations for Weighted Average Cost of Capital.
- Financial Ratios: Evaluate SB Financial Group, Inc.'s (SBFG) profitability, leverage, and efficiency.
- Editable Inputs: Change assumptions such as growth, margins, and CAPEX to fit your scenarios.
- Financial Statements: Annual and quarterly reports to support detailed analysis.
- Interactive Dashboard: Easily visualize key valuation metrics and results.
Disclaimer
All information, articles, and product details provided on this website are for general informational and educational purposes only. We do not claim any ownership over, nor do we intend to infringe upon, any trademarks, copyrights, logos, brand names, or other intellectual property mentioned or depicted on this site. Such intellectual property remains the property of its respective owners, and any references here are made solely for identification or informational purposes, without implying any affiliation, endorsement, or partnership.
We make no representations or warranties, express or implied, regarding the accuracy, completeness, or suitability of any content or products presented. Nothing on this website should be construed as legal, tax, investment, financial, medical, or other professional advice. In addition, no part of this site—including articles or product references—constitutes a solicitation, recommendation, endorsement, advertisement, or offer to buy or sell any securities, franchises, or other financial instruments, particularly in jurisdictions where such activity would be unlawful.
All content is of a general nature and may not address the specific circumstances of any individual or entity. It is not a substitute for professional advice or services. Any actions you take based on the information provided here are strictly at your own risk. You accept full responsibility for any decisions or outcomes arising from your use of this website and agree to release us from any liability in connection with your use of, or reliance upon, the content or products found herein.