
|
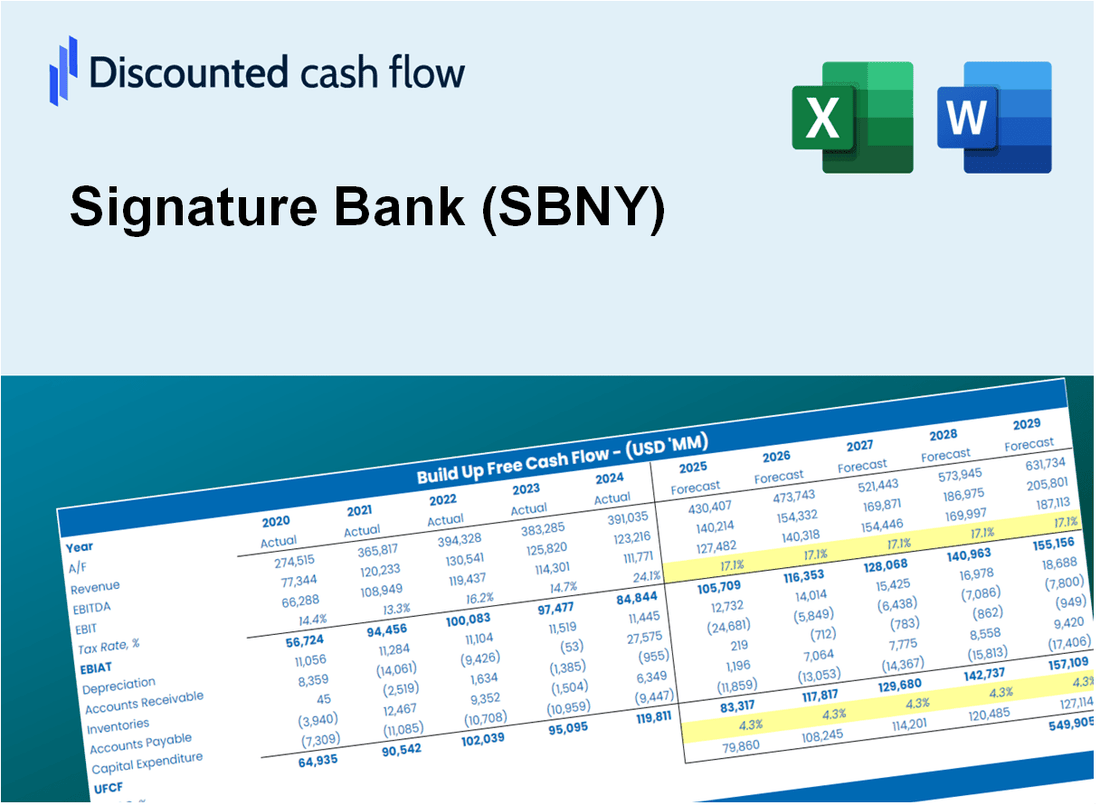
Signature Bank (SBNY) DCF -Bewertung |
Fully Editable: Tailor To Your Needs In Excel Or Sheets
Professional Design: Trusted, Industry-Standard Templates
Investor-Approved Valuation Models
MAC/PC Compatible, Fully Unlocked
No Expertise Is Needed; Easy To Follow
Signature Bank (SBNY) Bundle
Unser (SBNY) DCF-Taschenrechner entwickelt für die Genauigkeit und ermöglicht es Ihnen, die Bewertung der Signature-Bank anhand von Finanzdaten mit realer Welt zu bewerten, und bietet vollständige Flexibilität, um alle Schlüsselparameter für verbesserte Projektionen zu ändern.
Discounted Cash Flow (DCF) - (USD MM)
| Year | AY1 2018 |
AY2 2019 |
AY3 2020 |
AY4 2021 |
AY5 2022 |
FY1 2023 |
FY2 2024 |
FY3 2025 |
FY4 2026 |
FY5 2027 |
|---|---|---|---|---|---|---|---|---|---|---|
| Revenue | 1,322.3 | 1,339.5 | 1,594.3 | 2,001.4 | 2,696.4 | 3,239.6 | 3,892.2 | 4,676.3 | 5,618.4 | 6,750.3 |
| Revenue Growth, % | 0 | 1.31 | 19.02 | 25.53 | 34.72 | 20.15 | 20.15 | 20.15 | 20.15 | 20.15 |
| EBITDA | .0 | .0 | .0 | .0 | .0 | .0 | .0 | .0 | .0 | .0 |
| EBITDA, % | 0 | 0 | 0 | 0 | 0 | 0 | 0 | 0 | 0 | 0 |
| Depreciation | 14.0 | 20.1 | 20.7 | 21.0 | 23.3 | 37.4 | 45.0 | 54.0 | 64.9 | 78.0 |
| Depreciation, % | 1.06 | 1.5 | 1.3 | 1.05 | 0.86501 | 1.16 | 1.16 | 1.16 | 1.16 | 1.16 |
| EBIT | -14.0 | -20.1 | -20.7 | -21.0 | -23.3 | -37.4 | -45.0 | -54.0 | -64.9 | -78.0 |
| EBIT, % | -1.06 | -1.5 | -1.3 | -1.05 | -0.86501 | -1.16 | -1.16 | -1.16 | -1.16 | -1.16 |
| Total Cash | 7,618.9 | 7,933.7 | 21,238.7 | 46,773.5 | 24,548.7 | 3,239.6 | 3,892.2 | 4,676.3 | 5,618.4 | 6,750.3 |
| Total Cash, percent | .0 | .0 | .0 | .0 | .0 | .0 | .0 | .0 | .0 | .0 |
| Account Receivables | 141.8 | 147.5 | 277.8 | 306.8 | 449.8 | 461.2 | 554.1 | 665.7 | 799.8 | 960.9 |
| Account Receivables, % | 10.73 | 11.01 | 17.42 | 15.33 | 16.68 | 14.24 | 14.24 | 14.24 | 14.24 | 14.24 |
| Inventories | .0 | .0 | .0 | .0 | .0 | .0 | .0 | .0 | .0 | .0 |
| Inventories, % | 0 | 0 | 0 | 0 | 0 | 0 | 0 | 0 | 0 | 0 |
| Accounts Payable | .0 | .0 | .0 | .0 | .0 | .0 | .0 | .0 | .0 | .0 |
| Accounts Payable, % | 0 | 0 | 0 | 0 | 0 | 0 | 0 | 0 | 0 | 0 |
| Capital Expenditure | -11.5 | -32.9 | -35.0 | -32.2 | -48.3 | -57.8 | -69.5 | -83.5 | -100.3 | -120.5 |
| Capital Expenditure, % | -0.86874 | -2.46 | -2.2 | -1.61 | -1.79 | -1.79 | -1.79 | -1.79 | -1.79 | -1.79 |
| Tax Rate, % | 23.83 | 23.83 | 23.83 | 23.83 | 23.83 | 23.83 | 23.83 | 23.83 | 23.83 | 23.83 |
| EBITAT | -10.1 | -14.4 | -14.9 | -15.5 | -17.8 | -27.4 | -32.9 | -39.5 | -47.5 | -57.0 |
| Depreciation | ||||||||||
| Changes in Account Receivables | ||||||||||
| Changes in Inventories | ||||||||||
| Changes in Accounts Payable | ||||||||||
| Capital Expenditure | ||||||||||
| UFCF | -149.4 | -32.9 | -159.6 | -55.7 | -185.8 | -59.1 | -150.3 | -180.6 | -217.0 | -260.7 |
| WACC, % | 6.18 | 6.11 | 6.18 | 6.3 | 6.51 | 6.26 | 6.26 | 6.26 | 6.26 | 6.26 |
| PV UFCF | ||||||||||
| SUM PV UFCF | -702.0 | |||||||||
| Long Term Growth Rate, % | 2.00 | |||||||||
| Free cash flow (T + 1) | -266 | |||||||||
| Terminal Value | -6,249 | |||||||||
| Present Terminal Value | -4,613 | |||||||||
| Enterprise Value | -5,315 | |||||||||
| Net Debt | 6,182 | |||||||||
| Equity Value | -11,498 | |||||||||
| Diluted Shares Outstanding, MM | 63 | |||||||||
| Equity Value Per Share | -183.66 |
What You Will Get
- Real SBNY Financials: Access to historical and projected data for precise valuation.
- Customizable Inputs: Adjust WACC, tax rates, revenue growth, and capital expenditures as needed.
- Dynamic Calculations: Intrinsic value and NPV are computed in real-time.
- Scenario Analysis: Evaluate various scenarios to assess Signature Bank's future performance.
- User-Friendly Design: Designed for professionals while remaining approachable for newcomers.
Key Features
- Comprehensive DCF Tool: Offers in-depth unlevered and levered DCF valuation frameworks.
- WACC Estimator: Ready-to-use Weighted Average Cost of Capital template with adjustable parameters.
- Customizable Forecast Inputs: Adjust growth projections, capital expenditures, and discount rates as needed.
- Integrated Financial Ratios: Evaluate profitability, leverage, and efficiency ratios specifically for Signature Bank (SBNY).
- Visual Dashboard and Graphs: Graphical representations highlight essential valuation metrics for straightforward analysis.
How It Works
- Download: Get the ready-to-use Excel file featuring Signature Bank's (SBNY) financial data.
- Customize: Modify forecasts, including revenue growth, EBITDA %, and WACC.
- Update Automatically: The intrinsic value and NPV calculations refresh in real-time.
- Test Scenarios: Generate multiple projections and instantly compare outcomes.
- Make Decisions: Utilize the valuation results to inform your investment strategy.
Why Choose This Calculator for Signature Bank (SBNY)?
- Accurate Data: Up-to-date Signature Bank financials provide trustworthy valuation outcomes.
- Customizable: Modify essential parameters such as growth rates, WACC, and tax rates to align with your forecasts.
- Time-Saving: Pre-configured calculations save you from starting from the ground up.
- Professional-Grade Tool: Tailored for investors, analysts, and financial consultants.
- User-Friendly: Easy-to-navigate design and clear instructions make it accessible for all users.
Who Should Use This Product?
- Investors: Evaluate Signature Bank's (SBNY) valuation before making investment decisions.
- CFOs and Financial Analysts: Optimize valuation methodologies and assess financial forecasts.
- Startup Founders: Understand how established banks like Signature Bank (SBNY) are valued in the market.
- Consultants: Provide comprehensive valuation analyses for clients in the banking sector.
- Students and Educators: Utilize real-world examples to teach and learn valuation strategies.
What the Template Contains
- Preloaded SBNY Data: Historical and projected financial data, including revenue, net income, and loan growth.
- DCF and WACC Models: Professional-grade sheets for calculating intrinsic value and Weighted Average Cost of Capital.
- Editable Inputs: Yellow-highlighted cells for adjusting loan growth, interest rates, and discount rates.
- Financial Statements: Comprehensive annual and quarterly financials for deeper analysis.
- Key Ratios: Profitability, leverage, and liquidity ratios to evaluate performance.
- Dashboard and Charts: Visual summaries of valuation outcomes and assumptions.
Disclaimer
All information, articles, and product details provided on this website are for general informational and educational purposes only. We do not claim any ownership over, nor do we intend to infringe upon, any trademarks, copyrights, logos, brand names, or other intellectual property mentioned or depicted on this site. Such intellectual property remains the property of its respective owners, and any references here are made solely for identification or informational purposes, without implying any affiliation, endorsement, or partnership.
We make no representations or warranties, express or implied, regarding the accuracy, completeness, or suitability of any content or products presented. Nothing on this website should be construed as legal, tax, investment, financial, medical, or other professional advice. In addition, no part of this site—including articles or product references—constitutes a solicitation, recommendation, endorsement, advertisement, or offer to buy or sell any securities, franchises, or other financial instruments, particularly in jurisdictions where such activity would be unlawful.
All content is of a general nature and may not address the specific circumstances of any individual or entity. It is not a substitute for professional advice or services. Any actions you take based on the information provided here are strictly at your own risk. You accept full responsibility for any decisions or outcomes arising from your use of this website and agree to release us from any liability in connection with your use of, or reliance upon, the content or products found herein.