
|
Sabra Health Care Reit, Inc. (SBRA) DCF -Bewertung |
Fully Editable: Tailor To Your Needs In Excel Or Sheets
Professional Design: Trusted, Industry-Standard Templates
Investor-Approved Valuation Models
MAC/PC Compatible, Fully Unlocked
No Expertise Is Needed; Easy To Follow
Sabra Health Care REIT, Inc. (SBRA) Bundle
Entdecken Sie das finanzielle Potenzial von Sabra Health Care Reit, Inc. (SBRA) mit unserem benutzerfreundlichen DCF-Taschenrechner! Geben Sie Ihre Prognosen für Wachstum, Margen und Kosten ein, um den inneren Wert von Sabra Health Care Reit, Inc. (SBRA) zu berechnen und Ihren Investitionsansatz zu verfeinern.
What You Will Get
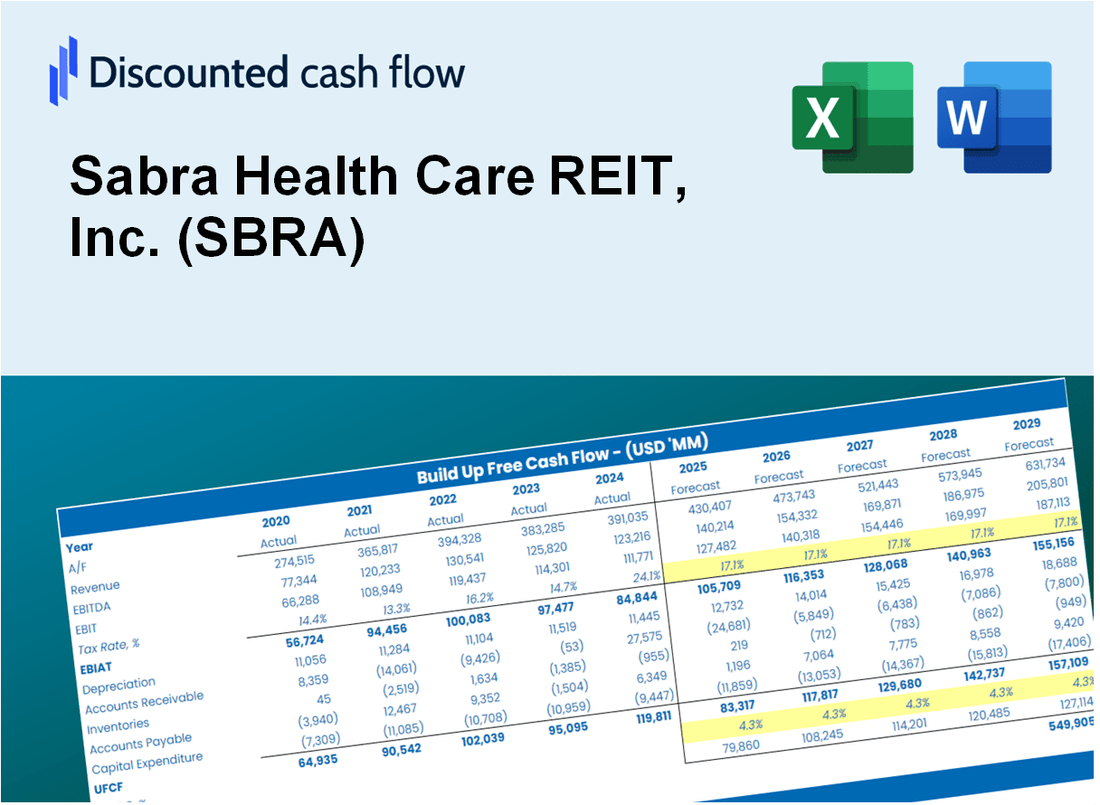
- Comprehensive SBRA Financials: Access to historical and projected data for precise valuation.
- Customizable Inputs: Adjust WACC, tax rates, revenue growth, and capital expenditures as needed.
- Real-Time Calculations: Intrinsic value and NPV are computed automatically.
- Scenario Analysis: Evaluate various scenarios to assess Sabra Health Care's future performance.
- User-Friendly Interface: Designed for industry experts while remaining approachable for newcomers.
Key Features
- Comprehensive SBRA Data: Includes Sabra Health Care REIT's historical performance metrics and future projections.
- Customizable Assumptions: Modify occupancy rates, rental growth, capital expenditures, and other key financial inputs.
- Interactive Valuation Tool: Instant recalculations of Net Asset Value (NAV) and intrinsic value based on user-defined parameters.
- Multiple Scenario Analysis: Develop various investment scenarios to evaluate different financial outcomes.
- Intuitive Interface: Designed for ease of use, catering to both industry experts and newcomers.
How It Works
- Step 1: Download the Excel file.
- Step 2: Review Sabra Health Care REIT, Inc.'s (SBRA) pre-filled financial data and forecasts.
- Step 3: Modify key inputs such as occupancy rates, rental growth, and operating expenses (highlighted cells).
- Step 4: Observe the DCF model refresh in real-time as you adjust your assumptions.
- Step 5: Evaluate the outputs and leverage the findings for your investment strategies.
Why Choose Sabra Health Care REIT, Inc. (SBRA)?
- Streamlined Investment: Access to a well-structured portfolio without the hassle of extensive research.
- Enhanced Returns: Proven strategies and reliable data help maximize your investment potential.
- Flexible Options: Customize your investment approach to align with your financial goals.
- User-Friendly Insights: Intuitive reports and visualizations simplify performance analysis.
- Endorsed by Industry Leaders: A trusted choice among investors prioritizing stability and growth.
Who Should Use This Product?
- Real Estate Investors: Gain insights into healthcare real estate with a specialized valuation tool.
- Financial Analysts: Streamline your analysis with a customizable DCF model tailored for healthcare REITs.
- Consultants: Effortlessly modify the template for client reports or presentations in the healthcare sector.
- Finance Enthusiasts: Enhance your knowledge of healthcare REIT valuation through practical examples.
- Educators and Students: Utilize it as a hands-on resource for finance and real estate courses.
What the Template Contains
- Pre-Filled Data: Includes Sabra Health Care REIT, Inc.'s (SBRA) historical financials and forecasts.
- Discounted Cash Flow Model: Editable DCF valuation model with automatic calculations.
- Weighted Average Cost of Capital (WACC): A dedicated sheet for calculating WACC based on custom inputs.
- Key Financial Ratios: Analyze Sabra Health Care REIT, Inc.'s (SBRA) profitability, efficiency, and leverage.
- Customizable Inputs: Edit revenue growth, margins, and tax rates with ease.
- Clear Dashboard: Charts and tables summarizing key valuation results.
Disclaimer
All information, articles, and product details provided on this website are for general informational and educational purposes only. We do not claim any ownership over, nor do we intend to infringe upon, any trademarks, copyrights, logos, brand names, or other intellectual property mentioned or depicted on this site. Such intellectual property remains the property of its respective owners, and any references here are made solely for identification or informational purposes, without implying any affiliation, endorsement, or partnership.
We make no representations or warranties, express or implied, regarding the accuracy, completeness, or suitability of any content or products presented. Nothing on this website should be construed as legal, tax, investment, financial, medical, or other professional advice. In addition, no part of this site—including articles or product references—constitutes a solicitation, recommendation, endorsement, advertisement, or offer to buy or sell any securities, franchises, or other financial instruments, particularly in jurisdictions where such activity would be unlawful.
All content is of a general nature and may not address the specific circumstances of any individual or entity. It is not a substitute for professional advice or services. Any actions you take based on the information provided here are strictly at your own risk. You accept full responsibility for any decisions or outcomes arising from your use of this website and agree to release us from any liability in connection with your use of, or reliance upon, the content or products found herein.