|
DCF -Bewertung der Starbucks Corporation (SBUX) |
Fully Editable: Tailor To Your Needs In Excel Or Sheets
Professional Design: Trusted, Industry-Standard Templates
Investor-Approved Valuation Models
MAC/PC Compatible, Fully Unlocked
No Expertise Is Needed; Easy To Follow
Starbucks Corporation (SBUX) Bundle
Gewinnen Sie mit unserem hochkarätigen DCF-Taschenrechner Einblick in Ihre SBUX-Bewertungsanalyse in Ihrer Starbucks Corporation (SBUX)! Diese Excel -Vorlage mit realen Daten (SBUX) -Daten ermöglicht es Ihnen, Prognosen und Annahmen für die genaue Bestimmung des inneren Werts der Starbucks Corporation anzupassen.
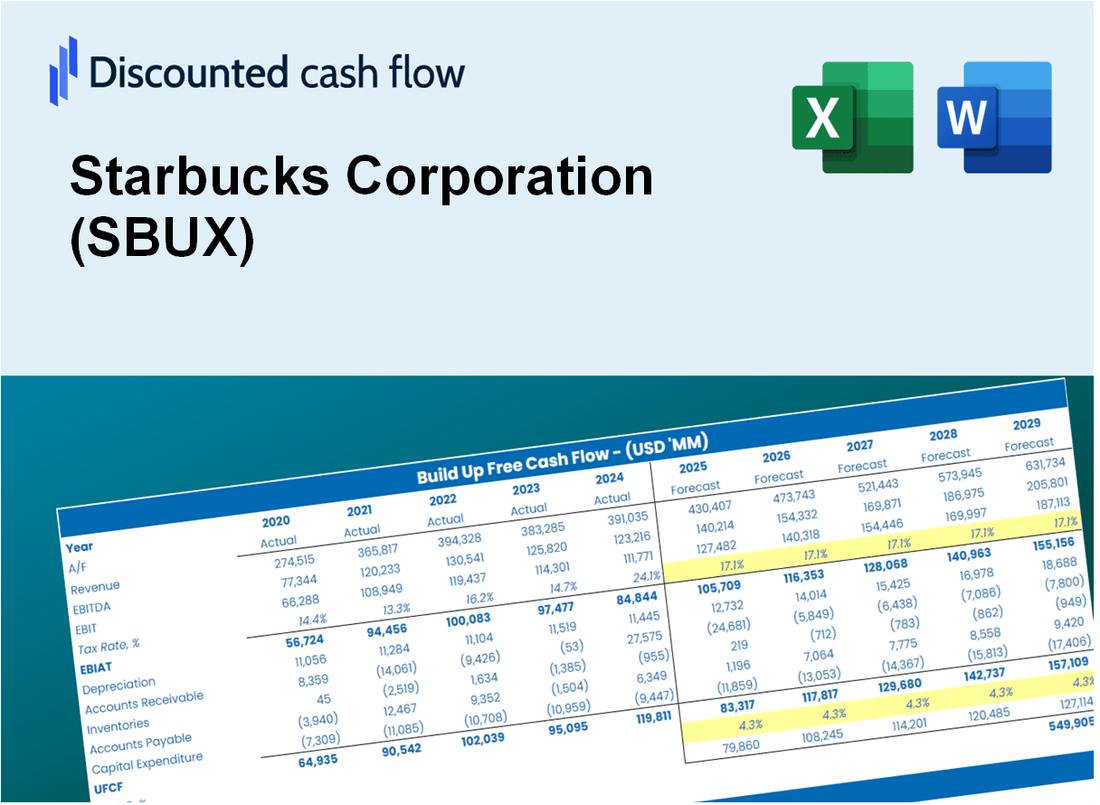
Discounted Cash Flow (DCF) - (USD MM)
| Year | AY1 2020 |
AY2 2021 |
AY3 2022 |
AY4 2023 |
AY5 2024 |
FY1 2025 |
FY2 2026 |
FY3 2027 |
FY4 2028 |
FY5 2029 |
|---|---|---|---|---|---|---|---|---|---|---|
| Revenue | 23,518.0 | 29,060.6 | 32,250.3 | 35,975.6 | 36,176.2 | 40,395.5 | 45,106.8 | 50,367.7 | 56,242.1 | 62,801.6 |
| Revenue Growth, % | 0 | 23.57 | 10.98 | 11.55 | 0.5576 | 11.66 | 11.66 | 11.66 | 11.66 | 11.66 |
| EBITDA | 3,104.6 | 7,350.8 | 6,244.2 | 7,402.3 | 7,124.0 | 7,927.7 | 8,852.3 | 9,884.7 | 11,037.6 | 12,324.9 |
| EBITDA, % | 13.2 | 25.29 | 19.36 | 20.58 | 19.69 | 19.63 | 19.63 | 19.63 | 19.63 | 19.63 |
| Depreciation | 1,503.2 | 1,524.1 | 1,529.4 | 1,450.3 | 1,592.4 | 2,004.6 | 2,238.4 | 2,499.4 | 2,790.9 | 3,116.4 |
| Depreciation, % | 6.39 | 5.24 | 4.74 | 4.03 | 4.4 | 4.96 | 4.96 | 4.96 | 4.96 | 4.96 |
| EBIT | 1,601.4 | 5,826.7 | 4,714.8 | 5,952.0 | 5,531.6 | 5,923.1 | 6,613.9 | 7,385.3 | 8,246.7 | 9,208.5 |
| EBIT, % | 6.81 | 20.05 | 14.62 | 16.54 | 15.29 | 14.66 | 14.66 | 14.66 | 14.66 | 14.66 |
| Total Cash | 4,632.1 | 6,617.9 | 3,182.9 | 3,953.0 | 3,543.2 | 5,907.5 | 6,596.5 | 7,365.8 | 8,224.9 | 9,184.2 |
| Total Cash, percent | .0 | .0 | .0 | .0 | .0 | .0 | .0 | .0 | .0 | .0 |
| Account Receivables | 1,395.4 | 1,133.1 | 1,175.5 | 1,184.1 | 1,213.8 | 1,625.8 | 1,815.5 | 2,027.2 | 2,263.6 | 2,527.6 |
| Account Receivables, % | 5.93 | 3.9 | 3.64 | 3.29 | 3.36 | 4.02 | 4.02 | 4.02 | 4.02 | 4.02 |
| Inventories | 1,551.4 | 1,603.9 | 2,176.6 | 1,806.4 | 1,777.3 | 2,326.7 | 2,598.1 | 2,901.1 | 3,239.4 | 3,617.2 |
| Inventories, % | 6.6 | 5.52 | 6.75 | 5.02 | 4.91 | 5.76 | 5.76 | 5.76 | 5.76 | 5.76 |
| Accounts Payable | 997.9 | 1,211.6 | 1,441.4 | 1,544.3 | 1,595.5 | 1,743.9 | 1,947.2 | 2,174.3 | 2,427.9 | 2,711.1 |
| Accounts Payable, % | 4.24 | 4.17 | 4.47 | 4.29 | 4.41 | 4.32 | 4.32 | 4.32 | 4.32 | 4.32 |
| Capital Expenditure | -1,483.6 | -1,470.0 | -1,841.3 | -2,333.6 | -2,777.5 | -2,523.9 | -2,818.3 | -3,147.0 | -3,514.1 | -3,923.9 |
| Capital Expenditure, % | -6.31 | -5.06 | -5.71 | -6.49 | -7.68 | -6.25 | -6.25 | -6.25 | -6.25 | -6.25 |
| Tax Rate, % | 24.32 | 24.32 | 24.32 | 24.32 | 24.32 | 24.32 | 24.32 | 24.32 | 24.32 | 24.32 |
| EBITAT | 1,276.7 | 4,567.6 | 3,656.1 | 4,544.5 | 4,186.2 | 4,592.7 | 5,128.3 | 5,726.4 | 6,394.3 | 7,140.1 |
| Depreciation | ||||||||||
| Changes in Account Receivables | ||||||||||
| Changes in Inventories | ||||||||||
| Changes in Accounts Payable | ||||||||||
| Capital Expenditure | ||||||||||
| UFCF | -652.6 | 5,045.2 | 2,958.9 | 4,125.7 | 3,051.7 | 3,260.2 | 4,290.7 | 4,791.2 | 5,350.0 | 5,973.9 |
| WACC, % | 7.16 | 7.15 | 7.14 | 7.13 | 7.13 | 7.14 | 7.14 | 7.14 | 7.14 | 7.14 |
| PV UFCF | ||||||||||
| SUM PV UFCF | 18,967.1 | |||||||||
| Long Term Growth Rate, % | 3.50 | |||||||||
| Free cash flow (T + 1) | 6,183 | |||||||||
| Terminal Value | 169,765 | |||||||||
| Present Terminal Value | 120,240 | |||||||||
| Enterprise Value | 139,207 | |||||||||
| Net Debt | 22,517 | |||||||||
| Equity Value | 116,690 | |||||||||
| Diluted Shares Outstanding, MM | 1,137 | |||||||||
| Equity Value Per Share | 102.60 |
What You Will Get
- Pre-Filled Financial Model: Starbucks’ actual data enables precise DCF valuation.
- Full Forecast Control: Adjust revenue growth, margins, WACC, and other key drivers.
- Instant Calculations: Automatic updates ensure you see results as you make changes.
- Investor-Ready Template: A refined Excel file designed for professional-grade valuation.
- Customizable and Reusable: Tailored for flexibility, allowing repeated use for detailed forecasts.
Key Features
- 🔍 Real-Life SBUX Financials: Pre-filled historical and projected data for Starbucks Corporation (SBUX).
- ✏️ Fully Customizable Inputs: Adjust all critical parameters (yellow cells) like WACC, growth %, and tax rates.
- 📊 Professional DCF Valuation: Built-in formulas calculate Starbucks’ intrinsic value using the Discounted Cash Flow method.
- ⚡ Instant Results: Visualize Starbucks’ valuation instantly after making changes.
- Scenario Analysis: Test and compare outcomes for various financial assumptions side-by-side.
How It Works
- 1. Access the Template: Download and open the Excel file featuring Starbucks Corporation’s (SBUX) preloaded data.
- 2. Modify Assumptions: Adjust key inputs such as growth rates, WACC, and capital expenditures.
- 3. Analyze Results Instantly: The DCF model automatically calculates intrinsic value and NPV for Starbucks Corporation (SBUX).
- 4. Explore Scenarios: Evaluate various forecasts to assess different valuation outcomes for Starbucks Corporation (SBUX).
- 5. Present with Confidence: Share professional valuation insights to enhance your decision-making for Starbucks Corporation (SBUX).
Why Choose This Calculator?
- User-Friendly Interface: Perfect for both novices and seasoned users.
- Customizable Inputs: Easily adjust parameters to suit your financial analysis.
- Real-Time Valuation: Observe immediate updates to Starbucks’ valuation as you change inputs.
- Preloaded Data: Comes with Starbucks’ actual financial figures for swift evaluations.
- Preferred by Experts: Utilized by investors and analysts for sound decision-making.
Who Should Use This Product?
- Individual Investors: Make informed decisions about buying or selling Starbucks stock (SBUX).
- Financial Analysts: Streamline valuation processes with ready-to-use financial models for Starbucks (SBUX).
- Consultants: Deliver professional valuation insights to clients quickly and accurately regarding Starbucks (SBUX).
- Business Owners: Understand how large companies like Starbucks (SBUX) are valued to guide your own strategy.
- Finance Students: Learn valuation techniques using real-world data and scenarios related to Starbucks (SBUX).
What the Template Contains
- Comprehensive DCF Model: Editable template featuring detailed valuation calculations.
- Real-World Data: Starbucks Corporation’s (SBUX) historical and projected financials preloaded for analysis.
- Customizable Parameters: Adjust WACC, growth rates, and tax assumptions to explore various scenarios.
- Financial Statements: Complete annual and quarterly breakdowns for enhanced insights.
- Key Ratios: In-built analysis for profitability, efficiency, and leverage metrics.
- Dashboard with Visual Outputs: Charts and tables designed for clear, actionable results.
Disclaimer
All information, articles, and product details provided on this website are for general informational and educational purposes only. We do not claim any ownership over, nor do we intend to infringe upon, any trademarks, copyrights, logos, brand names, or other intellectual property mentioned or depicted on this site. Such intellectual property remains the property of its respective owners, and any references here are made solely for identification or informational purposes, without implying any affiliation, endorsement, or partnership.
We make no representations or warranties, express or implied, regarding the accuracy, completeness, or suitability of any content or products presented. Nothing on this website should be construed as legal, tax, investment, financial, medical, or other professional advice. In addition, no part of this site—including articles or product references—constitutes a solicitation, recommendation, endorsement, advertisement, or offer to buy or sell any securities, franchises, or other financial instruments, particularly in jurisdictions where such activity would be unlawful.
All content is of a general nature and may not address the specific circumstances of any individual or entity. It is not a substitute for professional advice or services. Any actions you take based on the information provided here are strictly at your own risk. You accept full responsibility for any decisions or outcomes arising from your use of this website and agree to release us from any liability in connection with your use of, or reliance upon, the content or products found herein.