
|
SI-Bone, Inc. (SIBN) DCF-Bewertung |
Fully Editable: Tailor To Your Needs In Excel Or Sheets
Professional Design: Trusted, Industry-Standard Templates
Investor-Approved Valuation Models
MAC/PC Compatible, Fully Unlocked
No Expertise Is Needed; Easy To Follow
SI-BONE, Inc. (SIBN) Bundle
Erforschen Sie die finanziellen Aussichten von SI-Bone, Inc. (SIBN) mit unserem benutzerfreundlichen DCF-Taschenrechner! Geben Sie Ihre Annahmen in Bezug auf Wachstum, Margen und Ausgaben ein, um den intrinsischen Wert von SI-Bone, Inc. (SIBN) zu berechnen und Ihren Investitionsansatz zu verfeinern.
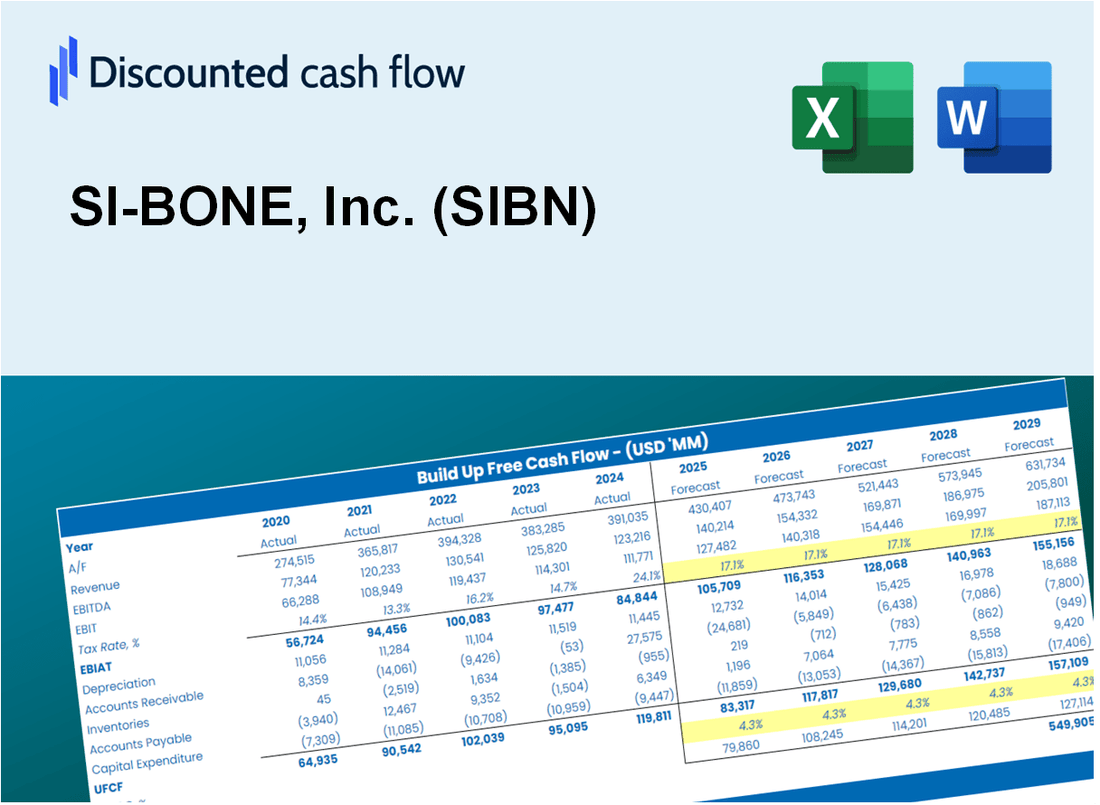
Discounted Cash Flow (DCF) - (USD MM)
| Year | AY1 2020 |
AY2 2021 |
AY3 2022 |
AY4 2023 |
AY5 2024 |
FY1 2025 |
FY2 2026 |
FY3 2027 |
FY4 2028 |
FY5 2029 |
|---|---|---|---|---|---|---|---|---|---|---|
| Revenue | 73.4 | 90.2 | 106.4 | 138.9 | 167.2 | 205.5 | 252.7 | 310.7 | 381.9 | 469.6 |
| Revenue Growth, % | 0 | 22.84 | 18.03 | 30.52 | 20.37 | 22.94 | 22.94 | 22.94 | 22.94 | 22.94 |
| EBITDA | -36.5 | -51.0 | -55.0 | -34.4 | -23.1 | -80.8 | -99.3 | -122.1 | -150.1 | -184.5 |
| EBITDA, % | -49.69 | -56.54 | -51.67 | -24.8 | -13.81 | -39.3 | -39.3 | -39.3 | -39.3 | -39.3 |
| Depreciation | 1.1 | 2.1 | 3.5 | 5.4 | 4.4 | 5.6 | 6.9 | 8.5 | 10.4 | 12.8 |
| Depreciation, % | 1.54 | 2.31 | 3.24 | 3.91 | 2.62 | 2.73 | 2.73 | 2.73 | 2.73 | 2.73 |
| EBIT | -37.6 | -53.1 | -58.4 | -39.9 | -27.5 | -86.4 | -106.2 | -130.6 | -160.5 | -197.3 |
| EBIT, % | -51.23 | -58.85 | -54.92 | -28.71 | -16.43 | -42.03 | -42.03 | -42.03 | -42.03 | -42.03 |
| Total Cash | 196.4 | 147.0 | 97.3 | 166.0 | 150.0 | 197.8 | 243.2 | 299.0 | 367.6 | 451.9 |
| Total Cash, percent | .0 | .0 | .0 | .0 | .0 | .0 | .0 | .0 | .0 | .0 |
| Account Receivables | 13.6 | 14.2 | 20.7 | 22.0 | 27.5 | 35.4 | 43.5 | 53.4 | 65.7 | 80.8 |
| Account Receivables, % | 18.55 | 15.8 | 19.43 | 15.81 | 16.43 | 17.2 | 17.2 | 17.2 | 17.2 | 17.2 |
| Inventories | 5.6 | 11.5 | 17.3 | 20.2 | 27.1 | 27.7 | 34.1 | 41.9 | 51.5 | 63.3 |
| Inventories, % | 7.68 | 12.75 | 16.24 | 14.58 | 16.19 | 13.49 | 13.49 | 13.49 | 13.49 | 13.49 |
| Accounts Payable | 3.3 | 3.2 | 6.3 | 4.6 | 6.5 | 8.7 | 10.7 | 13.1 | 16.1 | 19.8 |
| Accounts Payable, % | 4.46 | 3.55 | 5.9 | 3.3 | 3.88 | 4.22 | 4.22 | 4.22 | 4.22 | 4.22 |
| Capital Expenditure | -2.6 | -6.4 | -9.5 | -7.8 | -10.5 | -12.9 | -15.9 | -19.5 | -24.0 | -29.5 |
| Capital Expenditure, % | -3.49 | -7.09 | -8.93 | -5.62 | -6.28 | -6.28 | -6.28 | -6.28 | -6.28 | -6.28 |
| Tax Rate, % | 0 | 0 | 0 | 0 | 0 | 0 | 0 | 0 | 0 | 0 |
| EBITAT | -37.6 | -53.1 | -58.4 | -39.9 | -27.5 | -86.4 | -106.2 | -130.6 | -160.5 | -197.3 |
| Depreciation | ||||||||||
| Changes in Account Receivables | ||||||||||
| Changes in Inventories | ||||||||||
| Changes in Accounts Payable | ||||||||||
| Capital Expenditure | ||||||||||
| UFCF | -55.0 | -63.9 | -73.6 | -48.2 | -44.0 | -100.1 | -127.7 | -157.0 | -193.0 | -237.2 |
| WACC, % | 7.55 | 7.55 | 7.55 | 7.55 | 7.55 | 7.55 | 7.55 | 7.55 | 7.55 | 7.55 |
| PV UFCF | ||||||||||
| SUM PV UFCF | -638.7 | |||||||||
| Long Term Growth Rate, % | 2.00 | |||||||||
| Free cash flow (T + 1) | -242 | |||||||||
| Terminal Value | -4,361 | |||||||||
| Present Terminal Value | -3,031 | |||||||||
| Enterprise Value | -3,670 | |||||||||
| Net Debt | 3 | |||||||||
| Equity Value | -3,672 | |||||||||
| Diluted Shares Outstanding, MM | 41 | |||||||||
| Equity Value Per Share | -88.56 |
What You Will Get
- Pre-Filled Financial Model: SI-BONE, Inc.’s actual data facilitates accurate DCF valuation.
- Full Forecast Control: Modify revenue growth, margins, WACC, and other essential drivers.
- Instant Calculations: Automatic updates provide real-time results as you adjust inputs.
- Investor-Ready Template: A polished Excel file crafted for high-quality valuation.
- Customizable and Reusable: Designed for adaptability, enabling repeated use for comprehensive forecasts.
Key Features
- Accurate Financial Data: Gain access to reliable pre-loaded historical figures and future estimates for SI-BONE, Inc. (SIBN).
- Tailorable Forecast Inputs: Modify highlighted cells to adjust metrics such as WACC, growth rates, and profit margins.
- Real-Time Calculations: Benefit from automatic updates to DCF, Net Present Value (NPV), and cash flow assessments.
- Interactive Dashboard: Utilize clear charts and summaries to effectively visualize your valuation findings.
- Designed for All Skill Levels: A user-friendly layout crafted for investors, CFOs, and consultants alike.
How It Works
- Step 1: Download the prebuilt Excel template featuring SI-BONE, Inc. (SIBN) data.
- Step 2: Review the pre-filled sheets to familiarize yourself with the essential metrics.
- Step 3: Modify forecasts and assumptions in the editable yellow cells (WACC, growth, margins).
- Step 4: Immediately see the updated results, including the intrinsic value of SI-BONE, Inc. (SIBN).
- Step 5: Utilize the outputs to make informed investment choices or create detailed reports.
Why Choose This Calculator for SI-BONE, Inc. (SIBN)?
- User-Friendly Interface: Tailored for both novices and seasoned professionals.
- Customizable Inputs: Adjust parameters easily to suit your specific analysis needs.
- Real-Time Feedback: Observe immediate updates to SI-BONE’s valuation as you change inputs.
- Preloaded Data: Comes with SI-BONE’s actual financial information for swift evaluations.
- Relied Upon by Experts: Utilized by investors and analysts for making well-informed choices.
Who Should Use SI-BONE, Inc. (SIBN)?
- Healthcare Professionals: Enhance patient care with innovative solutions for spinal surgery.
- Investors: Make informed decisions by analyzing the growth potential of a leader in orthopedic technologies.
- Surgeons: Utilize cutting-edge products designed to improve surgical outcomes and efficiency.
- Medical Researchers: Explore advanced technologies and methodologies in the field of spine surgery.
- Educators and Students: Leverage real-world applications of orthopedic innovations in academic settings.
What the Template Contains
- Preloaded SIBN Data: Historical and projected financial data, including revenue, EBIT, and capital expenditures.
- DCF and WACC Models: Professional-grade sheets for calculating intrinsic value and Weighted Average Cost of Capital.
- Editable Inputs: Yellow-highlighted cells for adjusting revenue growth, tax rates, and discount rates.
- Financial Statements: Comprehensive annual and quarterly financials for deeper analysis.
- Key Ratios: Profitability, leverage, and efficiency ratios to evaluate performance.
- Dashboard and Charts: Visual summaries of valuation outcomes and assumptions.
Disclaimer
All information, articles, and product details provided on this website are for general informational and educational purposes only. We do not claim any ownership over, nor do we intend to infringe upon, any trademarks, copyrights, logos, brand names, or other intellectual property mentioned or depicted on this site. Such intellectual property remains the property of its respective owners, and any references here are made solely for identification or informational purposes, without implying any affiliation, endorsement, or partnership.
We make no representations or warranties, express or implied, regarding the accuracy, completeness, or suitability of any content or products presented. Nothing on this website should be construed as legal, tax, investment, financial, medical, or other professional advice. In addition, no part of this site—including articles or product references—constitutes a solicitation, recommendation, endorsement, advertisement, or offer to buy or sell any securities, franchises, or other financial instruments, particularly in jurisdictions where such activity would be unlawful.
All content is of a general nature and may not address the specific circumstances of any individual or entity. It is not a substitute for professional advice or services. Any actions you take based on the information provided here are strictly at your own risk. You accept full responsibility for any decisions or outcomes arising from your use of this website and agree to release us from any liability in connection with your use of, or reliance upon, the content or products found herein.