
|
Skechers USA, Inc. (SKX) DCF -Bewertung |
Fully Editable: Tailor To Your Needs In Excel Or Sheets
Professional Design: Trusted, Industry-Standard Templates
Investor-Approved Valuation Models
MAC/PC Compatible, Fully Unlocked
No Expertise Is Needed; Easy To Follow
Skechers U.S.A., Inc. (SKX) Bundle
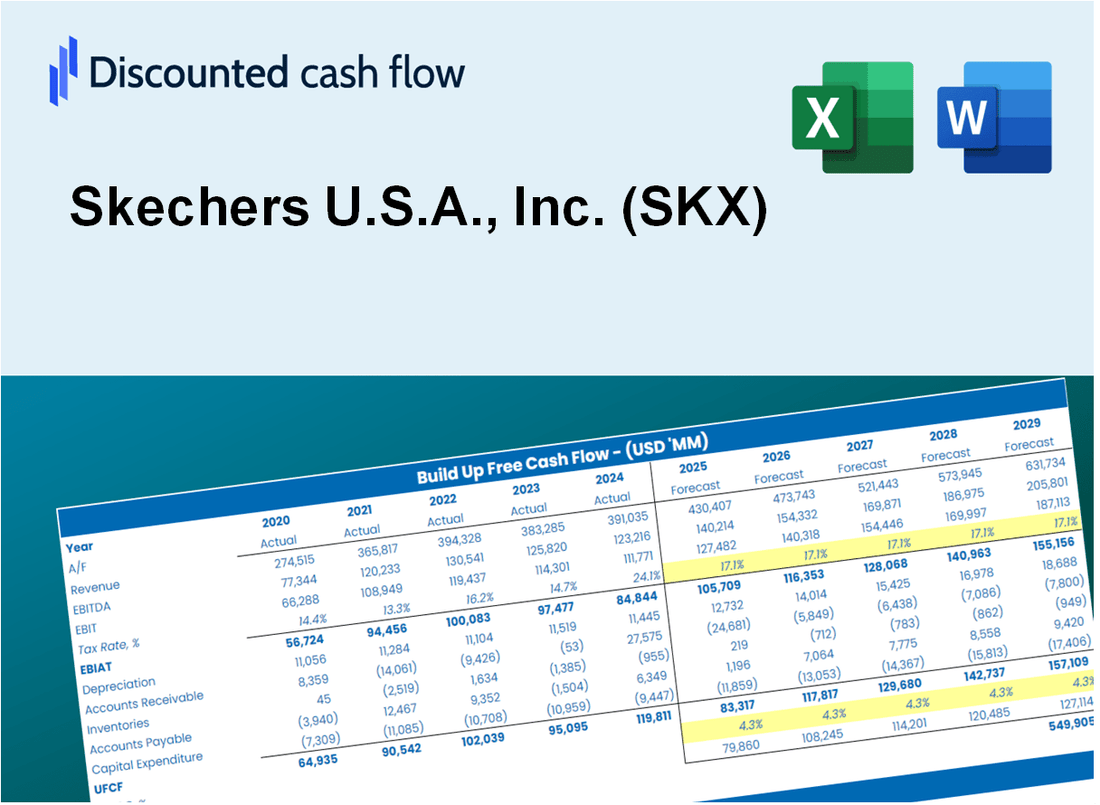
Unser (SKX) DCF-Taschenrechner entwickelt für die Genauigkeit und ermöglicht es Ihnen, die Bewertung von Skechers USA, Inc. unter Verwendung realer Finanzdaten zu bewerten, und bietet vollständige Flexibilität, um alle wesentlichen Parameter für verbesserte Projektionen zu ändern.
What You Will Get
- Real SKX Financials: Access to historical and projected data for precise valuation.
- Customizable Inputs: Adjust WACC, tax rates, revenue growth, and capital expenditures as needed.
- Dynamic Calculations: Intrinsic value and NPV are computed automatically.
- Scenario Analysis: Evaluate various scenarios to assess Skechers' future performance.
- User-Friendly Design: Designed for professionals while remaining approachable for newcomers.
Key Features
- 🔍 Real-Life SKX Financials: Pre-filled historical and projected data for Skechers U.S.A., Inc.
- ✏️ Fully Customizable Inputs: Adjust all critical parameters (yellow cells) like WACC, growth %, and tax rates.
- 📊 Professional DCF Valuation: Built-in formulas calculate Skechers’ intrinsic value using the Discounted Cash Flow method.
- ⚡ Instant Results: Visualize Skechers’ valuation instantly after making changes.
- Scenario Analysis: Test and compare outcomes for various financial assumptions side-by-side.
How It Works
- 1. Access the Template: Download and open the Excel file containing Skechers U.S.A., Inc. (SKX) preloaded data.
- 2. Modify Key Inputs: Adjust essential parameters such as growth rates, WACC, and capital expenditures.
- 3. Analyze Results Immediately: The DCF model automatically computes intrinsic value and NPV in real-time.
- 4. Experiment with Scenarios: Evaluate various forecasts to explore different valuation possibilities.
- 5. Present with Assurance: Deliver professional valuation analyses to back your strategic decisions.
Why Choose This Calculator for Skechers U.S.A., Inc. (SKX)?
- All-in-One Solution: Combines DCF, WACC, and financial ratio analyses tailored for Skechers.
- Flexible Inputs: Modify the highlighted cells to explore different financial scenarios for (SKX).
- In-Depth Analysis: Automatically computes Skechers’ intrinsic value and Net Present Value.
- Preloaded Information: Access historical and projected data for precise evaluations.
- Expert-Level Tool: Perfect for financial analysts, investors, and business advisors focusing on (SKX).
Who Should Use Skechers U.S.A., Inc. (SKX)?
- Retail Investors: Make informed investment choices with insights into a leading footwear brand.
- Market Analysts: Streamline your research with comprehensive data on Skechers' performance and market trends.
- Brand Consultants: Easily tailor your presentations or reports with detailed brand analysis.
- Shoe Enthusiasts: Enhance your knowledge of footwear industry dynamics through real-world case studies.
- Students and Educators: Utilize it as a hands-on resource in courses focused on business and marketing.
What the Template Contains
- Pre-Filled DCF Model: Skechers U.S.A., Inc.'s (SKX) financial data preloaded for immediate use.
- WACC Calculator: Detailed calculations for Weighted Average Cost of Capital.
- Financial Ratios: Evaluate Skechers' profitability, leverage, and efficiency.
- Editable Inputs: Change assumptions such as growth, margins, and CAPEX to fit your scenarios.
- Financial Statements: Annual and quarterly reports to support detailed analysis.
- Interactive Dashboard: Easily visualize key valuation metrics and results.
Disclaimer
All information, articles, and product details provided on this website are for general informational and educational purposes only. We do not claim any ownership over, nor do we intend to infringe upon, any trademarks, copyrights, logos, brand names, or other intellectual property mentioned or depicted on this site. Such intellectual property remains the property of its respective owners, and any references here are made solely for identification or informational purposes, without implying any affiliation, endorsement, or partnership.
We make no representations or warranties, express or implied, regarding the accuracy, completeness, or suitability of any content or products presented. Nothing on this website should be construed as legal, tax, investment, financial, medical, or other professional advice. In addition, no part of this site—including articles or product references—constitutes a solicitation, recommendation, endorsement, advertisement, or offer to buy or sell any securities, franchises, or other financial instruments, particularly in jurisdictions where such activity would be unlawful.
All content is of a general nature and may not address the specific circumstances of any individual or entity. It is not a substitute for professional advice or services. Any actions you take based on the information provided here are strictly at your own risk. You accept full responsibility for any decisions or outcomes arising from your use of this website and agree to release us from any liability in connection with your use of, or reliance upon, the content or products found herein.