
|
Simon Property Group, Inc. (SPG) DCF -Bewertung |
Fully Editable: Tailor To Your Needs In Excel Or Sheets
Professional Design: Trusted, Industry-Standard Templates
Investor-Approved Valuation Models
MAC/PC Compatible, Fully Unlocked
No Expertise Is Needed; Easy To Follow
Simon Property Group, Inc. (SPG) Bundle
Verbessern Sie Ihre Investitionsauswahl mit dem [Symbol] DCF -Taschenrechner! Erforschen Sie die Authentic Simon Property Group Financials, passen Sie die Wachstumsprojektionen und -kosten an und beobachten Sie sofort, wie sich diese Veränderungen auf den Intrinsischen Wert auswirken.
What You Will Get
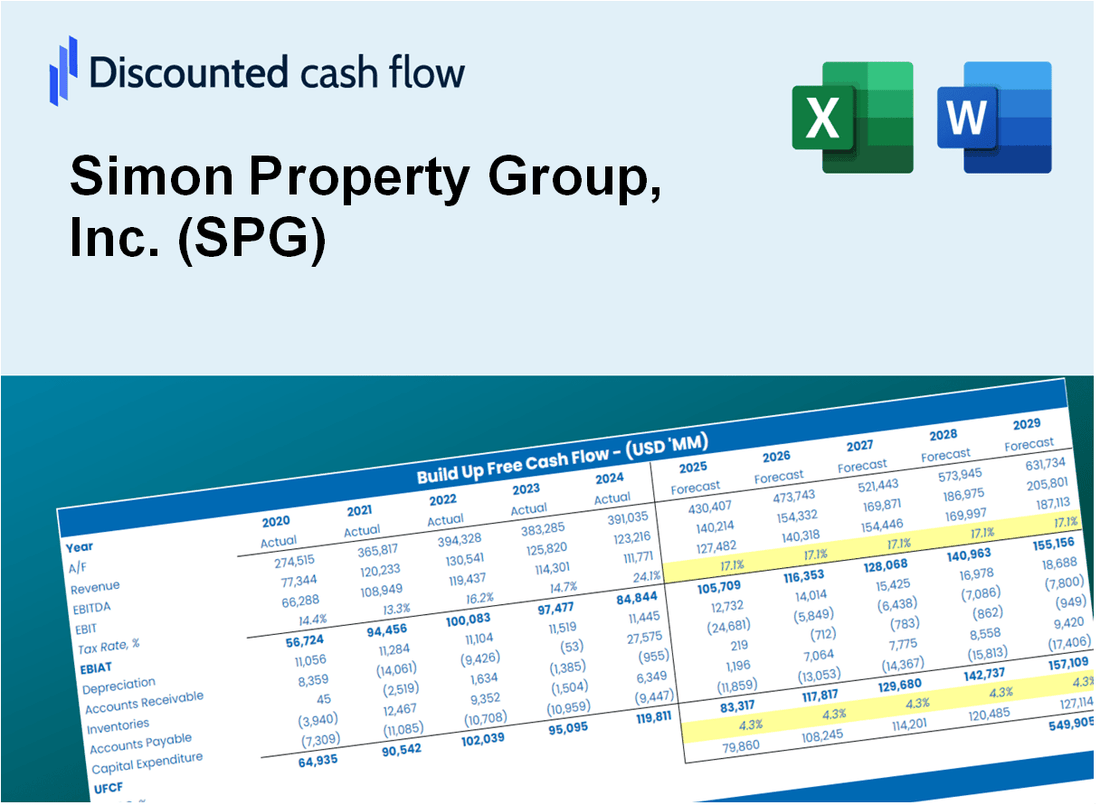
- Real Simon Property Group Data: Preloaded financials – from revenue to EBIT – based on actual and projected figures.
- Full Customization: Adjust all critical parameters (yellow cells) like WACC, growth %, and tax rates.
- Instant Valuation Updates: Automatic recalculations to analyze the impact of changes on Simon Property Group’s fair value.
- Versatile Excel Template: Tailored for quick edits, scenario testing, and detailed projections.
- Time-Saving and Accurate: Skip building models from scratch while maintaining precision and flexibility.
Key Features
- Comprehensive DCF Calculator: Features detailed unlevered and levered DCF valuation models tailored for Simon Property Group, Inc. (SPG).
- WACC Calculator: Pre-configured Weighted Average Cost of Capital sheet with adjustable input parameters.
- Customizable Forecast Assumptions: Alter growth rates, capital expenditures, and discount rates as needed.
- Integrated Financial Ratios: Evaluate profitability, leverage, and efficiency ratios specifically for Simon Property Group, Inc. (SPG).
- Interactive Dashboard and Charts: Visual representations that encapsulate key valuation metrics for straightforward analysis.
How It Works
- 1. Access the Template: Download and open the Excel file containing Simon Property Group, Inc. (SPG)'s preloaded data.
- 2. Adjust Key Inputs: Modify essential parameters such as growth rates, WACC, and capital expenditures.
- 3. Instant Results: The DCF model automatically calculates the intrinsic value and NPV based on your inputs.
- 4. Explore Different Scenarios: Analyze various forecasts to evaluate different valuation possibilities.
- 5. Make Informed Decisions: Present detailed valuation insights to back up your strategic choices.
Why Choose This Calculator for Simon Property Group, Inc. (SPG)?
- All-in-One Solution: Features DCF, WACC, and financial ratio analyses tailored for real estate investments.
- Flexible Inputs: Modify yellow-highlighted cells to explore different investment scenarios.
- In-Depth Analysis: Automatically computes Simon Property Group’s intrinsic value and Net Present Value.
- Preloaded Information: Historical and projected data provide reliable starting points for analysis.
- High-Quality Standards: Perfect for real estate analysts, investors, and business advisors.
Who Should Use This Product?
- Real Estate Investors: Develop comprehensive and accurate valuation models for property analysis.
- Corporate Finance Teams: Evaluate valuation scenarios to inform strategic decisions within the company.
- Consultants and Advisors: Offer clients precise valuation insights for Simon Property Group, Inc. (SPG).
- Students and Educators: Utilize real-world data to practice and teach financial modeling in real estate.
- Market Analysts: Gain insights into how real estate investment trusts (REITs) like Simon Property Group, Inc. (SPG) are valued in the market.
What the Template Contains
- Pre-Filled Data: Includes Simon Property Group’s historical financials and forecasts.
- Discounted Cash Flow Model: Editable DCF valuation model with automatic calculations.
- Weighted Average Cost of Capital (WACC): A dedicated sheet for calculating WACC based on custom inputs.
- Key Financial Ratios: Analyze Simon Property Group’s profitability, efficiency, and leverage.
- Customizable Inputs: Edit revenue growth, margins, and tax rates with ease.
- Clear Dashboard: Charts and tables summarizing key valuation results.
Disclaimer
All information, articles, and product details provided on this website are for general informational and educational purposes only. We do not claim any ownership over, nor do we intend to infringe upon, any trademarks, copyrights, logos, brand names, or other intellectual property mentioned or depicted on this site. Such intellectual property remains the property of its respective owners, and any references here are made solely for identification or informational purposes, without implying any affiliation, endorsement, or partnership.
We make no representations or warranties, express or implied, regarding the accuracy, completeness, or suitability of any content or products presented. Nothing on this website should be construed as legal, tax, investment, financial, medical, or other professional advice. In addition, no part of this site—including articles or product references—constitutes a solicitation, recommendation, endorsement, advertisement, or offer to buy or sell any securities, franchises, or other financial instruments, particularly in jurisdictions where such activity would be unlawful.
All content is of a general nature and may not address the specific circumstances of any individual or entity. It is not a substitute for professional advice or services. Any actions you take based on the information provided here are strictly at your own risk. You accept full responsibility for any decisions or outcomes arising from your use of this website and agree to release us from any liability in connection with your use of, or reliance upon, the content or products found herein.