
|
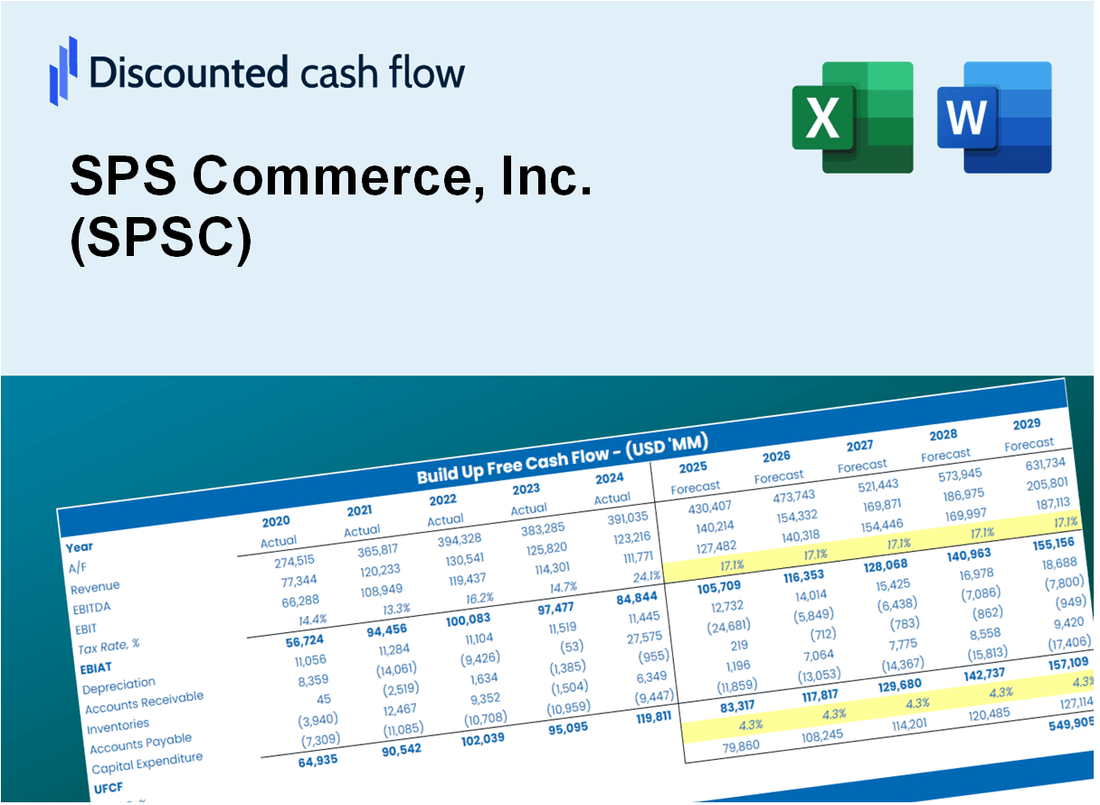
SPS Commerce, Inc. (SPSC) DCF -Bewertung |
Fully Editable: Tailor To Your Needs In Excel Or Sheets
Professional Design: Trusted, Industry-Standard Templates
Investor-Approved Valuation Models
MAC/PC Compatible, Fully Unlocked
No Expertise Is Needed; Easy To Follow
SPS Commerce, Inc. (SPSC) Bundle
Bewerten Sie die finanziellen Aussichten von SPS Commerce, Inc. (SPSC) wie ein Experte! Dieser (SPSC) DCF-Taschenrechner bietet Ihnen vorgefüllte Finanzdaten und die volle Flexibilität, um das Umsatzwachstum, WACC, Margen und andere wesentliche Annahmen zu ändern, um sich an Ihren Projektionen zu übereinstimmen.
What You Will Get
- Comprehensive SPSC Financials: Access to historical and projected data for precise valuation.
- Customizable Inputs: Adjust WACC, tax rates, revenue growth, and capital expenditures as needed.
- Dynamic Calculations: Intrinsic value and NPV are computed in real-time.
- Scenario Analysis: Evaluate various scenarios to assess SPS Commerce’s future outlook.
- User-Friendly Design: Designed for professionals while remaining approachable for newcomers.
Key Features
- Comprehensive SPSC Data: Pre-loaded with SPS Commerce’s historical performance metrics and future growth estimates.
- Flexible Input Options: Modify revenue projections, profit margins, discount rates, tax assumptions, and capital investments.
- Adaptive Valuation Framework: Instant recalculations of Net Present Value (NPV) and intrinsic value based on your modifications.
- Scenario Analysis: Develop various forecasting scenarios to explore different valuation results.
- Intuitive User Interface: Clean, organized layout suitable for both experienced analysts and newcomers.
How It Works
- Download: Obtain the pre-formatted Excel file featuring SPS Commerce, Inc.'s (SPSC) financial information.
- Customize: Modify forecasts, such as revenue growth, EBITDA %, and WACC to fit your analysis.
- Update Automatically: Watch as intrinsic value and NPV calculations refresh in real-time.
- Test Scenarios: Generate various projections and instantly assess different outcomes.
- Make Decisions: Leverage the valuation results to inform your investment choices.
Why Choose This Calculator for SPS Commerce, Inc. (SPSC)?
- All-in-One Solution: Combines DCF, WACC, and financial ratio analyses tailored for SPS Commerce.
- Flexible Parameters: Modify the yellow-highlighted fields to explore different financial scenarios.
- In-Depth Analysis: Automatically determines the intrinsic value and Net Present Value for SPS Commerce.
- Preloaded Information: Access to historical and projected data for precise calculations.
- Expert-Level Tool: Perfect for financial analysts, investors, and business advisors focusing on SPSC.
Who Should Use This Product?
- Investors: Assess the fair value of SPS Commerce, Inc. (SPSC) to inform your investment choices.
- CFOs: Utilize a high-quality DCF model for accurate financial reporting and analysis.
- Consultants: Easily customize the template for client valuation reports related to SPS Commerce.
- Entrepreneurs: Discover financial modeling techniques employed by leading companies in the industry.
- Educators: Implement it as a pedagogical resource to illustrate various valuation methods.
What the Template Contains
- Pre-Filled DCF Model: SPS Commerce, Inc.'s (SPSC) financial data preloaded for immediate use.
- WACC Calculator: Detailed calculations for Weighted Average Cost of Capital specific to SPS Commerce, Inc. (SPSC).
- Financial Ratios: Evaluate SPS Commerce, Inc.'s (SPSC) profitability, leverage, and efficiency.
- Editable Inputs: Change assumptions such as growth, margins, and CAPEX to fit your scenarios for SPS Commerce, Inc. (SPSC).
- Financial Statements: Annual and quarterly reports to support detailed analysis of SPS Commerce, Inc. (SPSC).
- Interactive Dashboard: Easily visualize key valuation metrics and results for SPS Commerce, Inc. (SPSC).
Disclaimer
All information, articles, and product details provided on this website are for general informational and educational purposes only. We do not claim any ownership over, nor do we intend to infringe upon, any trademarks, copyrights, logos, brand names, or other intellectual property mentioned or depicted on this site. Such intellectual property remains the property of its respective owners, and any references here are made solely for identification or informational purposes, without implying any affiliation, endorsement, or partnership.
We make no representations or warranties, express or implied, regarding the accuracy, completeness, or suitability of any content or products presented. Nothing on this website should be construed as legal, tax, investment, financial, medical, or other professional advice. In addition, no part of this site—including articles or product references—constitutes a solicitation, recommendation, endorsement, advertisement, or offer to buy or sell any securities, franchises, or other financial instruments, particularly in jurisdictions where such activity would be unlawful.
All content is of a general nature and may not address the specific circumstances of any individual or entity. It is not a substitute for professional advice or services. Any actions you take based on the information provided here are strictly at your own risk. You accept full responsibility for any decisions or outcomes arising from your use of this website and agree to release us from any liability in connection with your use of, or reliance upon, the content or products found herein.