
|
Surrozen, Inc. (SRZN) DCF -Bewertung |
Fully Editable: Tailor To Your Needs In Excel Or Sheets
Professional Design: Trusted, Industry-Standard Templates
Investor-Approved Valuation Models
MAC/PC Compatible, Fully Unlocked
No Expertise Is Needed; Easy To Follow
Surrozen, Inc. (SRZN) Bundle
Verbessern Sie Ihre Investitionsauswahl mit dem DCF -Taschenrechner von Surrozen, Inc. (SRZN)! Erforschen Sie reale Finanzdaten für Surrozen, passen Sie Wachstumsprojektionen und -kosten an und sehen Sie sofort, wie sich diese Anpassungen auf den inneren Wert von Surrozen, Inc. (SRZN) auswirken.
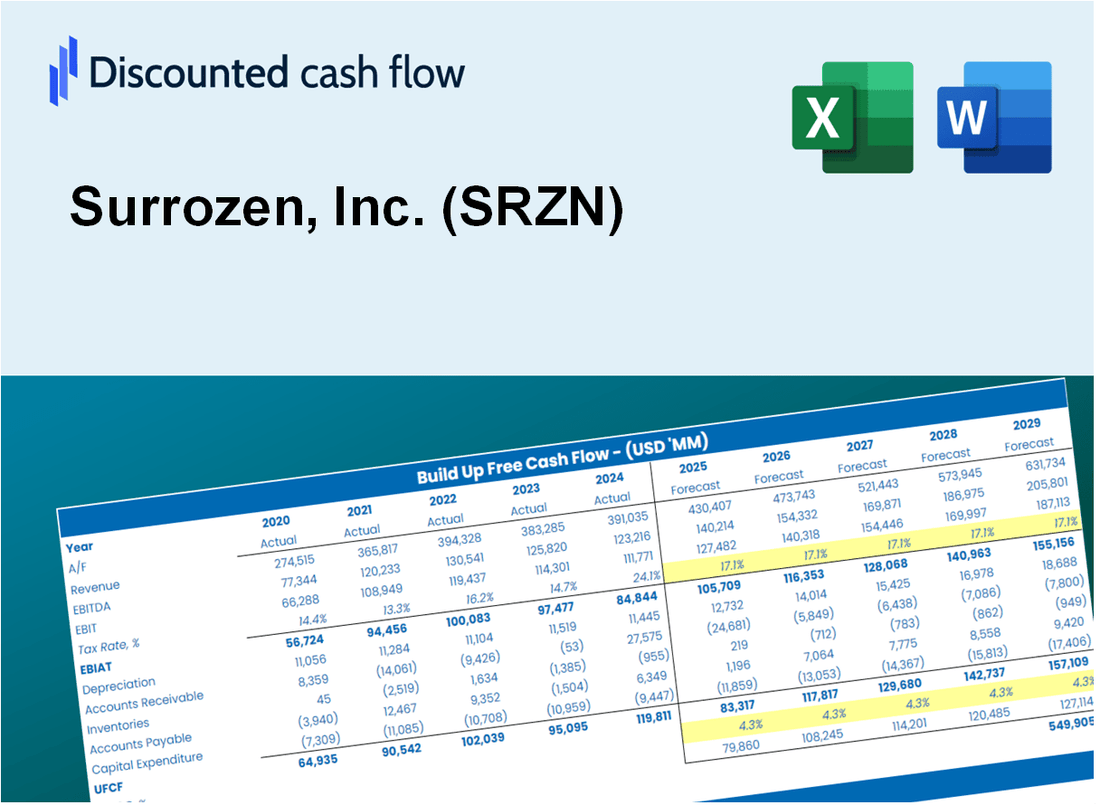
Discounted Cash Flow (DCF) - (USD MM)
| Year | AY1 2020 |
AY2 2021 |
AY3 2022 |
AY4 2023 |
AY5 2024 |
FY1 2025 |
FY2 2026 |
FY3 2027 |
FY4 2028 |
FY5 2029 |
|---|---|---|---|---|---|---|---|---|---|---|
| Revenue | .0 | .0 | 12.5 | .0 | 10.7 | 8.0 | 6.0 | 4.5 | 3.4 | 2.5 |
| Revenue Growth, % | 0 | 0 | 0 | -100 | 0 | -25 | -25 | -25 | -25 | -25 |
| EBITDA | -31.4 | -51.4 | -42.4 | -41.1 | -24.1 | 1.6 | 1.2 | .9 | .7 | .5 |
| EBITDA, % | 100 | 100 | -339.07 | 100 | -226.16 | 20 | 20 | 20 | 20 | 20 |
| Depreciation | 2.9 | 3.3 | 2.0 | 1.9 | 1.4 | 5.3 | 3.9 | 3.0 | 2.2 | 1.7 |
| Depreciation, % | 100 | 100 | 15.64 | 100 | 13.53 | 65.83 | 65.83 | 65.83 | 65.83 | 65.83 |
| EBIT | -34.3 | -54.6 | -44.3 | -43.0 | -25.5 | 1.6 | 1.2 | .9 | .7 | .5 |
| EBIT, % | 100 | 100 | -354.71 | 100 | -239.69 | 20 | 20 | 20 | 20 | 20 |
| Total Cash | 49.2 | 101.9 | 75.8 | 36.0 | 34.6 | 8.0 | 6.0 | 4.5 | 3.4 | 2.5 |
| Total Cash, percent | .0 | .0 | .0 | .0 | .0 | .0 | .0 | .0 | .0 | .0 |
| Account Receivables | .0 | .0 | 2.0 | 2.2 | 2.5 | 5.4 | 4.1 | 3.1 | 2.3 | 1.7 |
| Account Receivables, % | 100 | 100 | 15.82 | 100 | 23.85 | 67.93 | 67.93 | 67.93 | 67.93 | 67.93 |
| Inventories | .0 | .0 | .0 | .0 | .0 | 4.8 | 3.6 | 2.7 | 2.0 | 1.5 |
| Inventories, % | 100 | 100 | 0 | 100 | 0 | 60 | 60 | 60 | 60 | 60 |
| Accounts Payable | 1.8 | 2.7 | .7 | .5 | .3 | 4.9 | 3.7 | 2.8 | 2.1 | 1.6 |
| Accounts Payable, % | 100 | 100 | 5.26 | 100 | 2.87 | 61.63 | 61.63 | 61.63 | 61.63 | 61.63 |
| Capital Expenditure | -.9 | -1.3 | -.7 | -.4 | .0 | -.1 | -.1 | -.1 | .0 | .0 |
| Capital Expenditure, % | 100 | 100 | -5.82 | 100 | -0.24402 | -1.21 | -1.21 | -1.21 | -1.21 | -1.21 |
| Tax Rate, % | 0 | 0 | 0 | 0 | 0 | 0 | 0 | 0 | 0 | 0 |
| EBITAT | -34.2 | -52.5 | -44.3 | -43.0 | -25.5 | 1.6 | 1.2 | .9 | .7 | .5 |
| Depreciation | ||||||||||
| Changes in Account Receivables | ||||||||||
| Changes in Inventories | ||||||||||
| Changes in Accounts Payable | ||||||||||
| Capital Expenditure | ||||||||||
| UFCF | -30.4 | -49.5 | -47.2 | -41.8 | -24.7 | 3.7 | 6.4 | 4.8 | 3.6 | 2.7 |
| WACC, % | 6.2 | 6.17 | 6.2 | 6.2 | 6.2 | 6.19 | 6.19 | 6.19 | 6.19 | 6.19 |
| PV UFCF | ||||||||||
| SUM PV UFCF | 18.0 | |||||||||
| Long Term Growth Rate, % | 2.00 | |||||||||
| Free cash flow (T + 1) | 3 | |||||||||
| Terminal Value | 66 | |||||||||
| Present Terminal Value | 49 | |||||||||
| Enterprise Value | 66 | |||||||||
| Net Debt | -26 | |||||||||
| Equity Value | 93 | |||||||||
| Diluted Shares Outstanding, MM | 3 | |||||||||
| Equity Value Per Share | 31.56 |
What You Will Gain
- Comprehensive Financial Model: Surrozen’s actual data facilitates accurate DCF valuation.
- Complete Forecast Flexibility: Modify revenue growth, profit margins, WACC, and other essential variables.
- Real-Time Calculations: Immediate updates ensure you view results as adjustments are made.
- Professional-Grade Template: A polished Excel file crafted for high-quality valuation.
- Adaptable and Repeatable: Designed for versatility, allowing for ongoing use in detailed forecasting.
Key Features
- Real-Life SRZN Data: Pre-filled with Surrozen’s historical financials and future projections.
- Fully Customizable Inputs: Modify revenue growth, profit margins, WACC, tax rates, and capital expenditures as needed.
- Dynamic Valuation Model: Automatic updates to Net Present Value (NPV) and intrinsic value based on your adjustments.
- Scenario Testing: Develop various forecast scenarios to evaluate different valuation possibilities.
- User-Friendly Design: Intuitive, organized, and suitable for both professionals and newcomers.
How It Works
- 1. Access the Template: Download and open the Excel file containing Surrozen, Inc. (SRZN)'s preloaded data.
- 2. Adjust Assumptions: Modify key inputs such as growth rates, WACC, and capital expenditures relevant to Surrozen, Inc. (SRZN).
- 3. View Results Instantly: The DCF model automatically calculates the intrinsic value and NPV for Surrozen, Inc. (SRZN).
- 4. Explore Scenarios: Analyze various forecasts to assess different valuation outcomes for Surrozen, Inc. (SRZN).
- 5. Present with Confidence: Share professional valuation insights for Surrozen, Inc. (SRZN) to bolster your decision-making process.
Why Choose This Calculator for Surrozen, Inc. (SRZN)?
- Designed for Experts: A specialized tool utilized by investors, analysts, and biotech consultants.
- Accurate Data: Surrozen’s historical and projected financials are preloaded for precise analysis.
- Flexible Scenario Analysis: Effortlessly simulate various forecasts and assumptions.
- Comprehensive Outputs: Automatically computes intrinsic value, NPV, and essential metrics.
- User-Friendly: Step-by-step guidance ensures a smooth calculation process.
Who Should Use This Product?
- Professional Investors: Develop comprehensive and accurate valuation models for analyzing Surrozen, Inc. (SRZN) stock.
- Corporate Finance Teams: Evaluate valuation scenarios to inform strategic decisions within the organization.
- Consultants and Advisors: Deliver precise valuation insights to clients regarding Surrozen, Inc. (SRZN).
- Students and Educators: Utilize real-world data to enhance learning and practice in financial modeling.
- Biotechnology Enthusiasts: Gain insights into how biotech companies like Surrozen, Inc. (SRZN) are valued in the market.
What the Surrozen, Inc. (SRZN) Template Contains
- Pre-Filled Data: Includes Surrozen’s historical financials and projections.
- Discounted Cash Flow Model: Editable DCF valuation model with automated calculations.
- Weighted Average Cost of Capital (WACC): A dedicated sheet for calculating WACC based on user-defined inputs.
- Key Financial Ratios: Assess Surrozen’s profitability, efficiency, and leverage metrics.
- Customizable Inputs: Easily modify revenue growth, profit margins, and tax rates.
- Clear Dashboard: Visuals and tables summarizing essential valuation outcomes.
Disclaimer
All information, articles, and product details provided on this website are for general informational and educational purposes only. We do not claim any ownership over, nor do we intend to infringe upon, any trademarks, copyrights, logos, brand names, or other intellectual property mentioned or depicted on this site. Such intellectual property remains the property of its respective owners, and any references here are made solely for identification or informational purposes, without implying any affiliation, endorsement, or partnership.
We make no representations or warranties, express or implied, regarding the accuracy, completeness, or suitability of any content or products presented. Nothing on this website should be construed as legal, tax, investment, financial, medical, or other professional advice. In addition, no part of this site—including articles or product references—constitutes a solicitation, recommendation, endorsement, advertisement, or offer to buy or sell any securities, franchises, or other financial instruments, particularly in jurisdictions where such activity would be unlawful.
All content is of a general nature and may not address the specific circumstances of any individual or entity. It is not a substitute for professional advice or services. Any actions you take based on the information provided here are strictly at your own risk. You accept full responsibility for any decisions or outcomes arising from your use of this website and agree to release us from any liability in connection with your use of, or reliance upon, the content or products found herein.