
|
Shutterstock, Inc. (SSTK) DCF -Bewertung |
Fully Editable: Tailor To Your Needs In Excel Or Sheets
Professional Design: Trusted, Industry-Standard Templates
Investor-Approved Valuation Models
MAC/PC Compatible, Fully Unlocked
No Expertise Is Needed; Easy To Follow
Shutterstock, Inc. (SSTK) Bundle
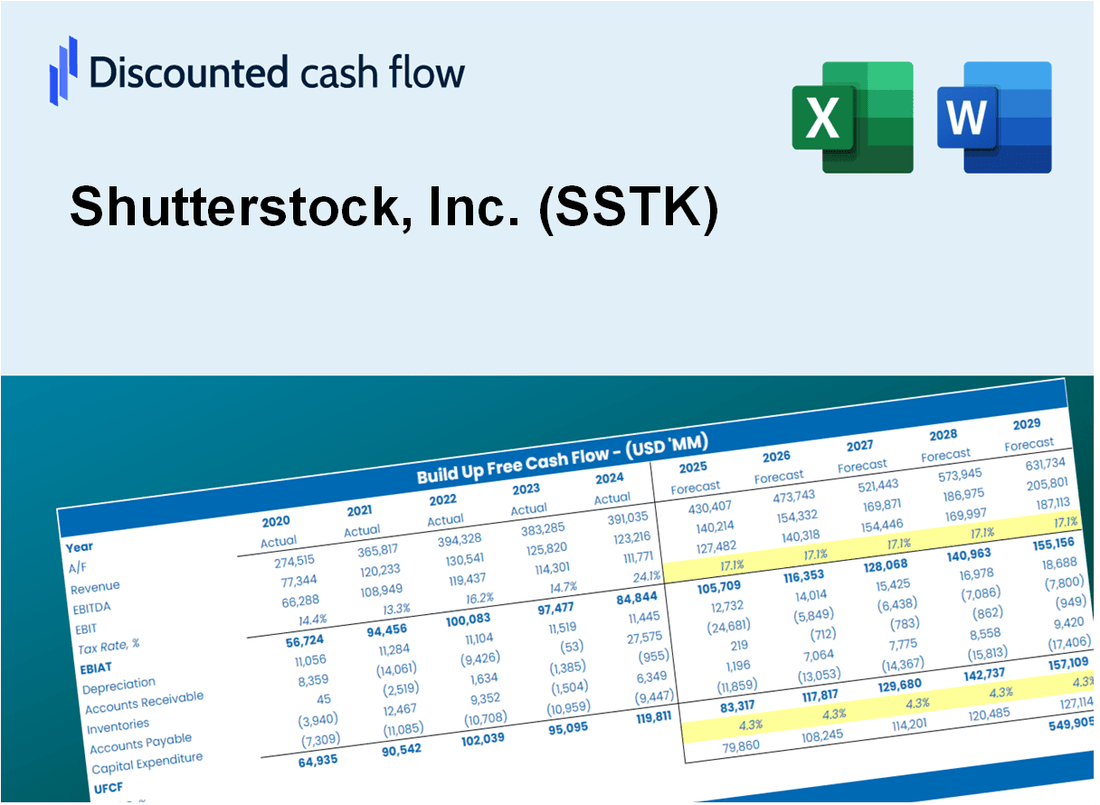
Verbessern Sie Ihre Investitionsauswahl mit dem DCF -Taschenrechner von Shutterstock, Inc. (SSTK)! Tauchen Sie in echte Verschlussstock -Finanzdaten ein, passen Sie die Wachstumsvorhersagen und -kosten an und beobachten Sie sofort, wie sich diese Veränderungen auf den inneren Wert von Shutterstock, Inc. (SSTK) auswirken.
What You Will Get
- Real SSTK Financials: Access to historical and projected data for precise valuation.
- Customizable Inputs: Adjust parameters such as WACC, tax rates, revenue growth, and capital expenditures.
- Dynamic Calculations: Intrinsic value and NPV are computed automatically.
- Scenario Analysis: Evaluate various scenarios to assess Shutterstock’s future performance.
- User-Friendly Design: Designed for professionals while remaining approachable for newcomers.
Key Features
- 🔍 Real-Life SSTK Financials: Pre-filled historical and projected data for Shutterstock, Inc.
- ✏️ Fully Customizable Inputs: Adjust all critical parameters (yellow cells) like WACC, growth %, and tax rates.
- 📊 Professional DCF Valuation: Built-in formulas calculate Shutterstock’s intrinsic value using the Discounted Cash Flow method.
- ⚡ Instant Results: Visualize Shutterstock’s valuation instantly after making changes.
- Scenario Analysis: Test and compare outcomes for various financial assumptions side-by-side.
How It Works
- Step 1: Download the Excel file.
- Step 2: Review Shutterstock's pre-filled financial data and forecasts.
- Step 3: Modify critical inputs like revenue growth, WACC, and tax rates (highlighted cells).
- Step 4: Watch the DCF model update instantly as you tweak assumptions.
- Step 5: Analyze the outputs and use the results for investment decisions.
Why Choose This Calculator for Shutterstock, Inc. (SSTK)?
- Designed for Experts: A sophisticated tool utilized by marketers, analysts, and financial advisors.
- Comprehensive Data: Shutterstock’s historical and projected financials are preloaded for precise analysis.
- Flexible Scenario Analysis: Effortlessly simulate various forecasts and assumptions.
- Insightful Outputs: Automatically computes intrinsic value, NPV, and essential financial metrics.
- User-Friendly: Step-by-step guidance ensures a smooth experience throughout the process.
Who Should Use This Product?
- Individual Creatives: Enhance your projects with high-quality stock images and videos from Shutterstock (SSTK).
- Marketing Professionals: Access a vast library of visual content to elevate your campaigns and presentations.
- Content Creators: Save time and effort by utilizing ready-to-use media assets for your online platforms.
- Business Owners: Improve your brand's visual identity by sourcing professional imagery that resonates with your audience.
- Students and Educators: Utilize Shutterstock (SSTK) for educational materials and projects that require compelling visuals.
What the Template Contains
- Pre-Filled Data: Includes Shutterstock, Inc.'s historical financials and projections.
- Discounted Cash Flow Model: Editable DCF valuation model with automatic calculations.
- Weighted Average Cost of Capital (WACC): A dedicated sheet for calculating WACC based on custom inputs.
- Key Financial Ratios: Analyze Shutterstock, Inc.'s profitability, efficiency, and leverage.
- Customizable Inputs: Edit revenue growth, margins, and tax rates with ease.
- Clear Dashboard: Charts and tables summarizing key valuation results.
Disclaimer
All information, articles, and product details provided on this website are for general informational and educational purposes only. We do not claim any ownership over, nor do we intend to infringe upon, any trademarks, copyrights, logos, brand names, or other intellectual property mentioned or depicted on this site. Such intellectual property remains the property of its respective owners, and any references here are made solely for identification or informational purposes, without implying any affiliation, endorsement, or partnership.
We make no representations or warranties, express or implied, regarding the accuracy, completeness, or suitability of any content or products presented. Nothing on this website should be construed as legal, tax, investment, financial, medical, or other professional advice. In addition, no part of this site—including articles or product references—constitutes a solicitation, recommendation, endorsement, advertisement, or offer to buy or sell any securities, franchises, or other financial instruments, particularly in jurisdictions where such activity would be unlawful.
All content is of a general nature and may not address the specific circumstances of any individual or entity. It is not a substitute for professional advice or services. Any actions you take based on the information provided here are strictly at your own risk. You accept full responsibility for any decisions or outcomes arising from your use of this website and agree to release us from any liability in connection with your use of, or reliance upon, the content or products found herein.