
|
Taboola.com Ltd. (TBLA) DCF -Bewertung |
Fully Editable: Tailor To Your Needs In Excel Or Sheets
Professional Design: Trusted, Industry-Standard Templates
Investor-Approved Valuation Models
MAC/PC Compatible, Fully Unlocked
No Expertise Is Needed; Easy To Follow
Taboola.com Ltd. (TBLA) Bundle
Verbessern Sie Ihre Anlagestrategien mit dem DCF -Taschenrechner von Taboola.com Ltd. (TBLA)! Verwenden Sie echte Taboola-Finanzdaten, passen Sie Wachstumsprojektionen und -kosten an und beobachten Sie, wie sich diese Modifikationen in Echtzeit auf den inneren Wert von Taboola.com Ltd. (TBLA) auswirken.
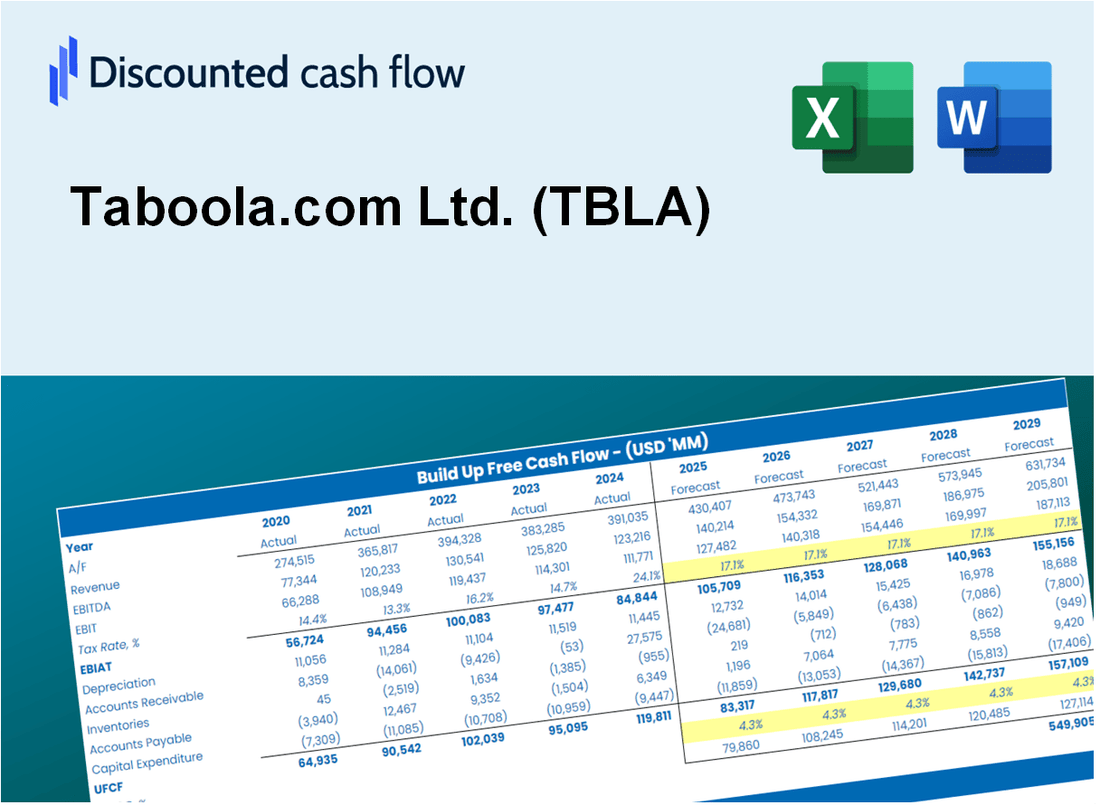
Discounted Cash Flow (DCF) - (USD MM)
| Year | AY1 2020 |
AY2 2021 |
AY3 2022 |
AY4 2023 |
AY5 2024 |
FY1 2025 |
FY2 2026 |
FY3 2027 |
FY4 2028 |
FY5 2029 |
|---|---|---|---|---|---|---|---|---|---|---|
| Revenue | 1,188.9 | 1,378.5 | 1,401.2 | 1,439.7 | 664.7 | 609.0 | 558.0 | 511.3 | 468.5 | 429.3 |
| Revenue Growth, % | 0 | 15.94 | 1.65 | 2.75 | -53.83 | -8.37 | -8.37 | -8.37 | -8.37 | -8.37 |
| EBITDA | 60.2 | 39.8 | 77.6 | 32.8 | 126.8 | 42.4 | 38.9 | 35.6 | 32.6 | 29.9 |
| EBITDA, % | 5.06 | 2.89 | 5.54 | 2.28 | 19.08 | 6.97 | 6.97 | 6.97 | 6.97 | 6.97 |
| Depreciation | 34.0 | 53.1 | 91.2 | 96.5 | 100.9 | 42.8 | 39.2 | 35.9 | 32.9 | 30.1 |
| Depreciation, % | 2.86 | 3.85 | 6.51 | 6.7 | 15.18 | 7.02 | 7.02 | 7.02 | 7.02 | 7.02 |
| EBIT | 26.2 | -13.3 | -13.7 | -63.7 | 25.9 | -.3 | -.3 | -.3 | -.2 | -.2 |
| EBIT, % | 2.2 | -0.96231 | -0.97527 | -4.43 | 3.9 | -0.05246423 | -0.05246423 | -0.05246423 | -0.05246423 | -0.05246423 |
| Total Cash | 242.8 | 319.3 | 262.8 | 181.8 | 230.4 | 133.5 | 122.4 | 112.1 | 102.7 | 94.1 |
| Total Cash, percent | .0 | .0 | .0 | .0 | .0 | .0 | .0 | .0 | .0 | .0 |
| Account Receivables | 158.1 | 245.2 | 256.7 | 306.3 | 370.1 | 153.9 | 141.0 | 129.2 | 118.4 | 108.5 |
| Account Receivables, % | 13.29 | 17.79 | 18.32 | 21.28 | 55.68 | 25.27 | 25.27 | 25.27 | 25.27 | 25.27 |
| Inventories | .0 | .0 | .0 | 1.4 | .0 | .1 | .1 | .1 | .1 | .1 |
| Inventories, % | 0 | 0 | 0 | 0.09772971 | 0 | 0.01954594 | 0.01954594 | 0.01954594 | 0.01954594 | 0.01954594 |
| Accounts Payable | 189.4 | 259.9 | 247.5 | 282.0 | 309.2 | 144.4 | 132.3 | 121.2 | 111.1 | 101.8 |
| Accounts Payable, % | 15.93 | 18.86 | 17.66 | 19.59 | 46.52 | 23.71 | 23.71 | 23.71 | 23.71 | 23.71 |
| Capital Expenditure | -17.8 | -39.1 | -34.9 | -32.1 | -35.2 | -17.5 | -16.0 | -14.7 | -13.4 | -12.3 |
| Capital Expenditure, % | -1.5 | -2.83 | -2.49 | -2.23 | -5.29 | -2.87 | -2.87 | -2.87 | -2.87 | -2.87 |
| Tax Rate, % | 126.98 | 126.98 | 126.98 | 126.98 | 126.98 | 126.98 | 126.98 | 126.98 | 126.98 | 126.98 |
| EBITAT | 9.5 | -167.8 | -36.8 | -68.3 | -7.0 | -.2 | -.2 | -.2 | -.2 | -.2 |
| Depreciation | ||||||||||
| Changes in Account Receivables | ||||||||||
| Changes in Inventories | ||||||||||
| Changes in Accounts Payable | ||||||||||
| Capital Expenditure | ||||||||||
| UFCF | 57.0 | -170.4 | -4.4 | -20.4 | 23.6 | 76.3 | 23.8 | 21.8 | 20.0 | 18.3 |
| WACC, % | 9 | 9.37 | 9.37 | 9.37 | 8.78 | 9.18 | 9.18 | 9.18 | 9.18 | 9.18 |
| PV UFCF | ||||||||||
| SUM PV UFCF | 132.5 | |||||||||
| Long Term Growth Rate, % | 2.00 | |||||||||
| Free cash flow (T + 1) | 19 | |||||||||
| Terminal Value | 260 | |||||||||
| Present Terminal Value | 168 | |||||||||
| Enterprise Value | 300 | |||||||||
| Net Debt | -46 | |||||||||
| Equity Value | 346 | |||||||||
| Diluted Shares Outstanding, MM | 343 | |||||||||
| Equity Value Per Share | 1.01 |
What You Will Get
- Real TBLA Financial Data: Pre-filled with Taboola’s historical and projected data for precise analysis.
- Fully Editable Template: Modify key inputs like revenue growth, WACC, and EBITDA % with ease.
- Automatic Calculations: See Taboola’s intrinsic value update instantly based on your changes.
- Professional Valuation Tool: Designed for investors, analysts, and consultants seeking accurate DCF results.
- User-Friendly Design: Simple structure and clear instructions for all experience levels.
Key Features
- Comprehensive DCF Calculator: Offers detailed unlevered and levered DCF valuation models tailored for Taboola.com Ltd. (TBLA).
- WACC Calculator: Includes a pre-built Weighted Average Cost of Capital sheet with adjustable inputs specific to TBLA.
- Customizable Forecast Assumptions: Easily modify growth rates, capital expenditures, and discount rates relevant to Taboola.com Ltd. (TBLA).
- Integrated Financial Ratios: Evaluate profitability, leverage, and efficiency ratios for Taboola.com Ltd. (TBLA).
- Interactive Dashboard and Charts: Visual representations of key valuation metrics facilitate straightforward analysis for Taboola.com Ltd. (TBLA).
How It Works
- Step 1: Download the Excel file.
- Step 2: Review Taboola.com Ltd.'s (TBLA) pre-filled financial data and forecasts.
- Step 3: Modify key inputs such as revenue growth, WACC, and tax rates (highlighted cells).
- Step 4: Observe the DCF model update in real-time as you adjust your assumptions.
- Step 5: Analyze the outputs and leverage the results for your investment decisions.
Why Choose This Calculator for Taboola.com Ltd. (TBLA)?
- Accurate Data: Up-to-date Taboola financials provide trustworthy valuation outcomes.
- Customizable: Modify essential parameters such as growth rates, WACC, and tax rates to align with your forecasts.
- Time-Saving: Built-in calculations save you from starting from the ground up.
- Professional-Grade Tool: Tailored for investors, analysts, and consultants in the digital marketing space.
- User-Friendly: Simple design and clear instructions ensure accessibility for all users.
Who Should Use This Product?
- Investors: Accurately assess Taboola.com Ltd.’s (TBLA) fair value prior to making investment choices.
- CFOs: Utilize a professional-grade DCF model for comprehensive financial reporting and analysis.
- Consultants: Efficiently customize the template for client valuation reports.
- Entrepreneurs: Acquire insights into the financial modeling practices of leading tech companies.
- Educators: Employ it as a pedagogical tool to illustrate valuation techniques.
What the Template Contains
- Operating and Balance Sheet Data: Pre-filled Taboola.com Ltd. (TBLA) historical data and forecasts, including revenue, EBITDA, EBIT, and capital expenditures.
- WACC Calculation: A dedicated sheet for Weighted Average Cost of Capital (WACC), including parameters like Beta, risk-free rate, and share price.
- DCF Valuation (Unlevered and Levered): Editable Discounted Cash Flow models showing intrinsic value with detailed calculations.
- Financial Statements: Pre-loaded financial statements (annual and quarterly) to support analysis.
- Key Ratios: Includes profitability, leverage, and efficiency ratios for Taboola.com Ltd. (TBLA).
- Dashboard and Charts: Visual summary of valuation outputs and assumptions to analyze results easily.
Disclaimer
All information, articles, and product details provided on this website are for general informational and educational purposes only. We do not claim any ownership over, nor do we intend to infringe upon, any trademarks, copyrights, logos, brand names, or other intellectual property mentioned or depicted on this site. Such intellectual property remains the property of its respective owners, and any references here are made solely for identification or informational purposes, without implying any affiliation, endorsement, or partnership.
We make no representations or warranties, express or implied, regarding the accuracy, completeness, or suitability of any content or products presented. Nothing on this website should be construed as legal, tax, investment, financial, medical, or other professional advice. In addition, no part of this site—including articles or product references—constitutes a solicitation, recommendation, endorsement, advertisement, or offer to buy or sell any securities, franchises, or other financial instruments, particularly in jurisdictions where such activity would be unlawful.
All content is of a general nature and may not address the specific circumstances of any individual or entity. It is not a substitute for professional advice or services. Any actions you take based on the information provided here are strictly at your own risk. You accept full responsibility for any decisions or outcomes arising from your use of this website and agree to release us from any liability in connection with your use of, or reliance upon, the content or products found herein.