
|
Reise- + Leisure Co. (TNL) DCF -Bewertung |
Fully Editable: Tailor To Your Needs In Excel Or Sheets
Professional Design: Trusted, Industry-Standard Templates
Investor-Approved Valuation Models
MAC/PC Compatible, Fully Unlocked
No Expertise Is Needed; Easy To Follow
Travel + Leisure Co. (TNL) Bundle
Unser DCF-Rechner von TNL (Travel + Leisure Co.) wurde für die Genauigkeit entwickelt und ermöglicht es Ihnen, die Bewertung von Travel + Leisure Co. unter Verwendung realer Finanzdaten zu bewerten und vollständige Flexibilität zu bieten, um alle wesentlichen Parameter für erweiterte Projektionen zu ändern.
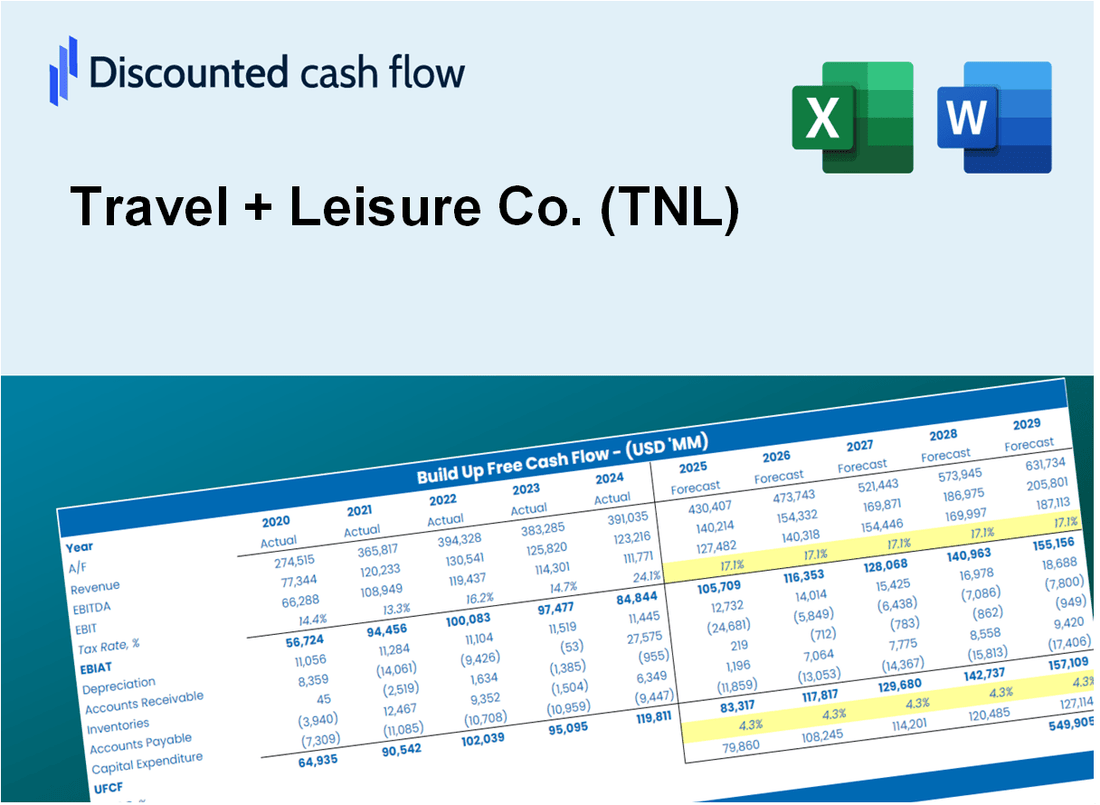
Discounted Cash Flow (DCF) - (USD MM)
| Year | AY1 2020 |
AY2 2021 |
AY3 2022 |
AY4 2023 |
AY5 2024 |
FY1 2025 |
FY2 2026 |
FY3 2027 |
FY4 2028 |
FY5 2029 |
|---|---|---|---|---|---|---|---|---|---|---|
| Revenue | 2,160.0 | 3,134.0 | 3,567.0 | 3,750.0 | 3,864.0 | 4,512.0 | 5,268.6 | 6,152.2 | 7,183.9 | 8,388.6 |
| Revenue Growth, % | 0 | 45.09 | 13.82 | 5.13 | 3.04 | 16.77 | 16.77 | 16.77 | 16.77 | 16.77 |
| EBITDA | 42.0 | 751.0 | 800.0 | 848.0 | 877.0 | 845.1 | 986.8 | 1,152.2 | 1,345.5 | 1,571.1 |
| EBITDA, % | 1.94 | 23.96 | 22.43 | 22.61 | 22.7 | 18.73 | 18.73 | 18.73 | 18.73 | 18.73 |
| Depreciation | 126.0 | 124.0 | 119.0 | 112.0 | 115.0 | 172.3 | 201.1 | 234.9 | 274.3 | 320.3 |
| Depreciation, % | 5.83 | 3.96 | 3.34 | 2.99 | 2.98 | 3.82 | 3.82 | 3.82 | 3.82 | 3.82 |
| EBIT | -84.0 | 627.0 | 681.0 | 736.0 | 762.0 | 672.8 | 785.6 | 917.4 | 1,071.2 | 1,250.8 |
| EBIT, % | -3.89 | 20.01 | 19.09 | 19.63 | 19.72 | 14.91 | 14.91 | 14.91 | 14.91 | 14.91 |
| Total Cash | 1,205.0 | 396.0 | 562.0 | 296.0 | 184.0 | 873.8 | 1,020.4 | 1,191.5 | 1,391.3 | 1,624.6 |
| Total Cash, percent | .0 | .0 | .0 | .0 | .0 | .0 | .0 | .0 | .0 | .0 |
| Account Receivables | 115.0 | 2,538.0 | 2,640.0 | 2,893.0 | 2,954.0 | 2,832.8 | 3,307.8 | 3,862.5 | 4,510.2 | 5,266.6 |
| Account Receivables, % | 5.32 | 80.98 | 74.01 | 77.15 | 76.45 | 62.78 | 62.78 | 62.78 | 62.78 | 62.78 |
| Inventories | 1,347.0 | 1,216.0 | 1,193.0 | 1,135.0 | 1,227.0 | 1,774.4 | 2,071.9 | 2,419.4 | 2,825.1 | 3,298.9 |
| Inventories, % | 62.36 | 38.8 | 33.45 | 30.27 | 31.75 | 39.33 | 39.33 | 39.33 | 39.33 | 39.33 |
| Accounts Payable | 62.0 | 62.0 | 65.0 | 73.0 | 67.0 | 93.4 | 109.1 | 127.4 | 148.7 | 173.7 |
| Accounts Payable, % | 2.87 | 1.98 | 1.82 | 1.95 | 1.73 | 2.07 | 2.07 | 2.07 | 2.07 | 2.07 |
| Capital Expenditure | -69.0 | -57.0 | -52.0 | -74.0 | -81.0 | -95.1 | -111.1 | -129.7 | -151.4 | -176.8 |
| Capital Expenditure, % | -3.19 | -1.82 | -1.46 | -1.97 | -2.1 | -2.11 | -2.11 | -2.11 | -2.11 | -2.11 |
| Tax Rate, % | 19.88 | 19.88 | 19.88 | 19.88 | 19.88 | 19.88 | 19.88 | 19.88 | 19.88 | 19.88 |
| EBITAT | -77.0 | 450.2 | 500.2 | 600.9 | 610.5 | 536.5 | 626.4 | 731.5 | 854.1 | 997.4 |
| Depreciation | ||||||||||
| Changes in Account Receivables | ||||||||||
| Changes in Inventories | ||||||||||
| Changes in Accounts Payable | ||||||||||
| Capital Expenditure | ||||||||||
| UFCF | -1,420.0 | -1,774.8 | 491.2 | 451.9 | 485.5 | 213.9 | -40.4 | -47.2 | -55.1 | -64.4 |
| WACC, % | 6.84 | 6.35 | 6.39 | 6.6 | 6.56 | 6.55 | 6.55 | 6.55 | 6.55 | 6.55 |
| PV UFCF | ||||||||||
| SUM PV UFCF | 36.4 | |||||||||
| Long Term Growth Rate, % | 0.50 | |||||||||
| Free cash flow (T + 1) | -65 | |||||||||
| Terminal Value | -1,070 | |||||||||
| Present Terminal Value | -779 | |||||||||
| Enterprise Value | -743 | |||||||||
| Net Debt | 5,503 | |||||||||
| Equity Value | -6,246 | |||||||||
| Diluted Shares Outstanding, MM | 71 | |||||||||
| Equity Value Per Share | -88.34 |
What You Will Get
- Real TNL Financial Data: Pre-filled with Travel + Leisure Co.’s historical and projected data for precise analysis.
- Fully Editable Template: Modify key inputs like revenue growth, WACC, and EBITDA % with ease.
- Automatic Calculations: See Travel + Leisure Co.’s intrinsic value update instantly based on your changes.
- Professional Valuation Tool: Designed for investors, analysts, and consultants seeking accurate DCF results.
- User-Friendly Design: Simple structure and clear instructions for all experience levels.
Key Features
- 🔍 Real-Life TNL Financials: Pre-filled historical and projected data for Travel + Leisure Co. (TNL).
- ✏️ Fully Customizable Inputs: Adjust all critical parameters (yellow cells) like WACC, growth %, and tax rates.
- 📊 Professional DCF Valuation: Built-in formulas calculate Travel + Leisure Co.’s intrinsic value using the Discounted Cash Flow method.
- ⚡ Instant Results: Visualize Travel + Leisure Co.’s valuation instantly after making changes.
- Scenario Analysis: Test and compare outcomes for various financial assumptions side-by-side.
How It Works
- Step 1: Download the Excel file.
- Step 2: Review pre-entered Travel + Leisure Co. (TNL) data (historical and projected).
- Step 3: Adjust key assumptions (yellow cells) based on your analysis.
- Step 4: View automatic recalculations for Travel + Leisure Co.’s intrinsic value.
- Step 5: Use the outputs for investment decisions or reporting.
Why Choose Travel + Leisure Co. (TNL)?
- Exceptional Experiences: Discover unique travel opportunities curated for every type of traveler.
- Expert Insights: Benefit from trusted advice and recommendations from industry professionals.
- Flexible Options: Customize your travel plans to fit your preferences and budget.
- User-Friendly Platform: Navigate our website easily to find the best deals and destinations.
- Community of Travelers: Join a network of like-minded adventurers who share their experiences and tips.
Who Should Use This Product?
- Investors: Evaluate Travel + Leisure Co.’s (TNL) market potential to inform investment choices.
- CFOs: Utilize a high-quality DCF model for comprehensive financial analysis and reporting.
- Consultants: Efficiently customize the template for client valuation reports in the travel industry.
- Entrepreneurs: Acquire knowledge about financial modeling practices employed by leading tourism companies.
- Educators: Implement it as a resource for teaching valuation techniques in finance courses.
What the Template Contains
- Pre-Filled Data: Includes Travel + Leisure Co.'s (TNL) historical financials and forecasts.
- Discounted Cash Flow Model: Editable DCF valuation model with automatic calculations tailored for (TNL).
- Weighted Average Cost of Capital (WACC): A dedicated sheet for calculating WACC based on custom inputs specific to (TNL).
- Key Financial Ratios: Analyze Travel + Leisure Co.'s (TNL) profitability, efficiency, and leverage.
- Customizable Inputs: Edit revenue growth, margins, and tax rates for (TNL) with ease.
- Clear Dashboard: Charts and tables summarizing key valuation results for (TNL).
Disclaimer
All information, articles, and product details provided on this website are for general informational and educational purposes only. We do not claim any ownership over, nor do we intend to infringe upon, any trademarks, copyrights, logos, brand names, or other intellectual property mentioned or depicted on this site. Such intellectual property remains the property of its respective owners, and any references here are made solely for identification or informational purposes, without implying any affiliation, endorsement, or partnership.
We make no representations or warranties, express or implied, regarding the accuracy, completeness, or suitability of any content or products presented. Nothing on this website should be construed as legal, tax, investment, financial, medical, or other professional advice. In addition, no part of this site—including articles or product references—constitutes a solicitation, recommendation, endorsement, advertisement, or offer to buy or sell any securities, franchises, or other financial instruments, particularly in jurisdictions where such activity would be unlawful.
All content is of a general nature and may not address the specific circumstances of any individual or entity. It is not a substitute for professional advice or services. Any actions you take based on the information provided here are strictly at your own risk. You accept full responsibility for any decisions or outcomes arising from your use of this website and agree to release us from any liability in connection with your use of, or reliance upon, the content or products found herein.