
|
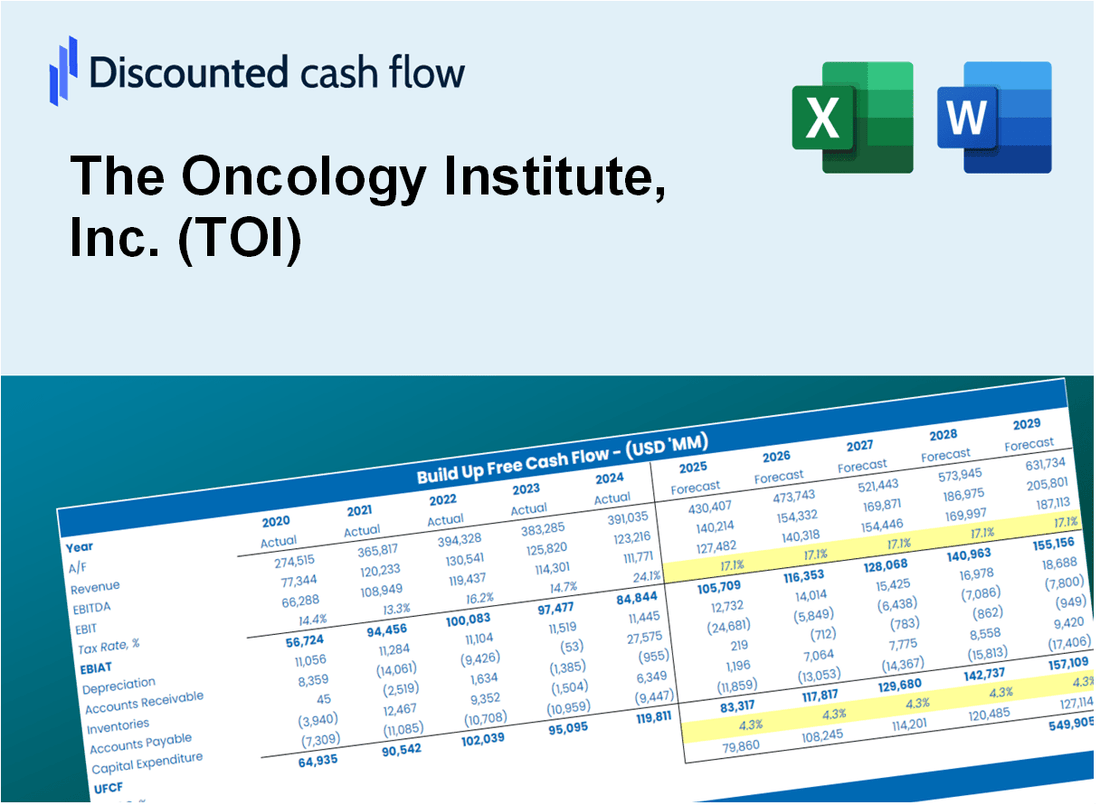
Die DCF -Bewertung der Onkologie Institute, Inc. (TOI) |
Fully Editable: Tailor To Your Needs In Excel Or Sheets
Professional Design: Trusted, Industry-Standard Templates
Investor-Approved Valuation Models
MAC/PC Compatible, Fully Unlocked
No Expertise Is Needed; Easy To Follow
The Oncology Institute, Inc. (TOI) Bundle
Entdecken Sie den wahren Wert des Oncology Institute, Inc. (TOI) mit unserem DCF-Taschenrechner von Professional Grade! Passen Sie die wichtigsten Annahmen an, erkunden Sie verschiedene Szenarien und beurteilen Sie, wie sich Änderungen auf die Bewertung des Onkologieinstituts auswirken - alles innerhalb einer einzigen Excel -Vorlage.
What You Will Get
- Comprehensive TOI Financials: Access to both historical and projected data for precise valuation.
- Customizable Parameters: Adjust WACC, tax rates, revenue growth, and capital expenditures as needed.
- Real-Time Calculations: Intrinsic value and NPV are computed automatically.
- Scenario Planning: Explore various scenarios to assess The Oncology Institute’s future performance.
- User-Friendly Interface: Designed for industry professionals while remaining approachable for newcomers.
Key Features
- Customizable Treatment Parameters: Adjust essential factors such as patient demographics, treatment efficacy, and cost of care.
- Instant Outcome Projections: Provides real-time estimates of patient outcomes and cost-effectiveness.
- High-Precision Analytics: Leverages TOI’s extensive clinical data for accurate treatment evaluations.
- Seamless Scenario Testing: Explore various treatment pathways and easily compare results.
- Efficiency-Boosting Solution: Streamlines the process of developing complex treatment models.
How It Works
- Step 1: Download the Excel file for The Oncology Institute, Inc. (TOI).
- Step 2: Review TOI’s pre-filled financial data and forecasts.
- Step 3: Modify key inputs such as patient growth, treatment costs, and reimbursement rates (highlighted cells).
- Step 4: Observe the DCF model update in real-time as you adjust your assumptions.
- Step 5: Analyze the outputs and leverage the results for informed investment decisions.
Why Choose The Oncology Institute, Inc. (TOI) Calculator?
- Comprehensive Tool: Integrates treatment cost analysis, patient outcome metrics, and financial projections in one solution.
- Customizable Inputs: Modify highlighted fields to explore different treatment scenarios and financial outcomes.
- Detailed Insights: Automatically computes the intrinsic value of TOI and forecasts future profitability.
- Preloaded Data: Access to historical treatment data and market trends for informed decision-making.
- Professional Quality: Perfect for healthcare analysts, investors, and oncology consultants.
Who Should Utilize This Service?
- Healthcare Professionals: Enhance patient care with advanced oncology treatment solutions.
- Researchers: Access valuable data and insights for groundbreaking cancer studies.
- Patients and Families: Find comprehensive support and resources tailored to your oncology needs.
- Healthcare Administrators: Streamline operations with efficient management tools designed for oncology practices.
- Students and Educators: Utilize it as a resource for learning about oncology and cancer care methodologies.
What the Template Contains
- Comprehensive DCF Model: Editable template featuring detailed valuation calculations tailored for The Oncology Institute, Inc. (TOI).
- Real-World Data: The Oncology Institute’s historical and projected financials preloaded for thorough analysis.
- Customizable Parameters: Modify WACC, growth rates, and tax assumptions to explore various scenarios.
- Financial Statements: Complete annual and quarterly breakdowns for enhanced insights into performance.
- Key Ratios: Integrated analysis for profitability, efficiency, and leverage specific to The Oncology Institute, Inc. (TOI).
- Dashboard with Visual Outputs: Charts and tables designed for clear, actionable results.
Disclaimer
All information, articles, and product details provided on this website are for general informational and educational purposes only. We do not claim any ownership over, nor do we intend to infringe upon, any trademarks, copyrights, logos, brand names, or other intellectual property mentioned or depicted on this site. Such intellectual property remains the property of its respective owners, and any references here are made solely for identification or informational purposes, without implying any affiliation, endorsement, or partnership.
We make no representations or warranties, express or implied, regarding the accuracy, completeness, or suitability of any content or products presented. Nothing on this website should be construed as legal, tax, investment, financial, medical, or other professional advice. In addition, no part of this site—including articles or product references—constitutes a solicitation, recommendation, endorsement, advertisement, or offer to buy or sell any securities, franchises, or other financial instruments, particularly in jurisdictions where such activity would be unlawful.
All content is of a general nature and may not address the specific circumstances of any individual or entity. It is not a substitute for professional advice or services. Any actions you take based on the information provided here are strictly at your own risk. You accept full responsibility for any decisions or outcomes arising from your use of this website and agree to release us from any liability in connection with your use of, or reliance upon, the content or products found herein.